Atlanta Region Used Car Market Report
January 2023
Used car sales trends for Atlanta and surrounding communities
January market trends based on used inventory from 709 dealers in the Atlanta region.
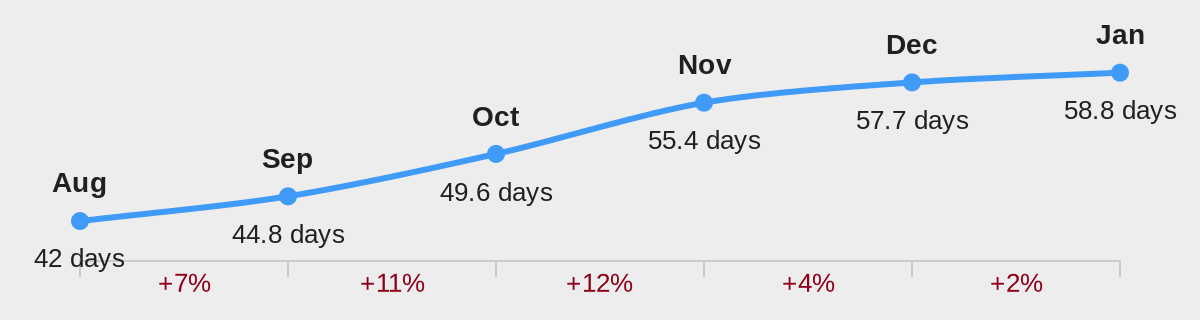
58.8 days
Average turn
Up 1.9%
35.4 days
Average vehicles sold per dealer
Down 3.4%
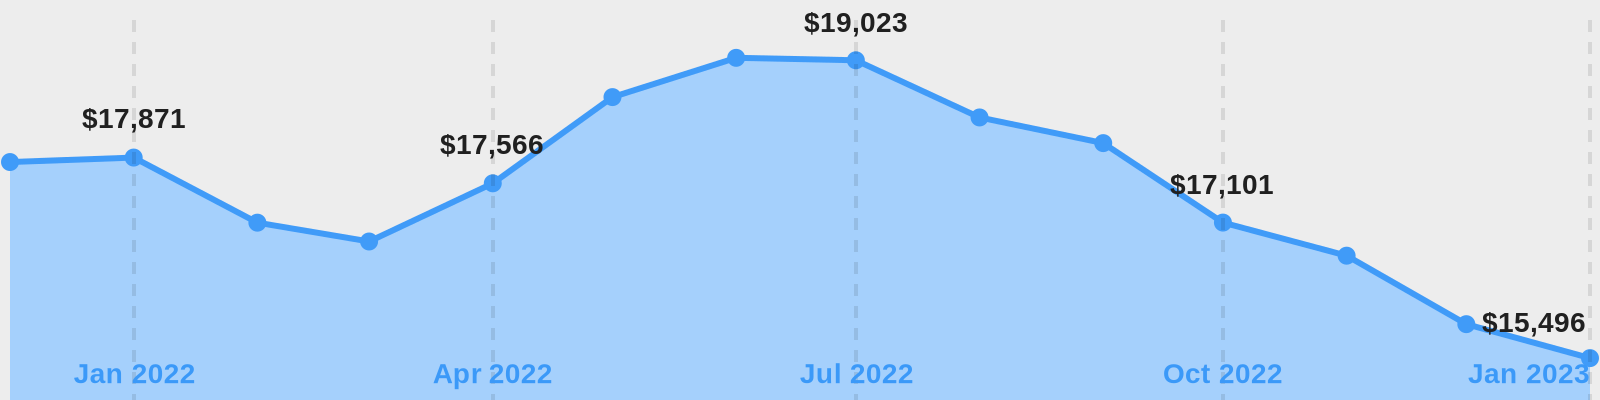
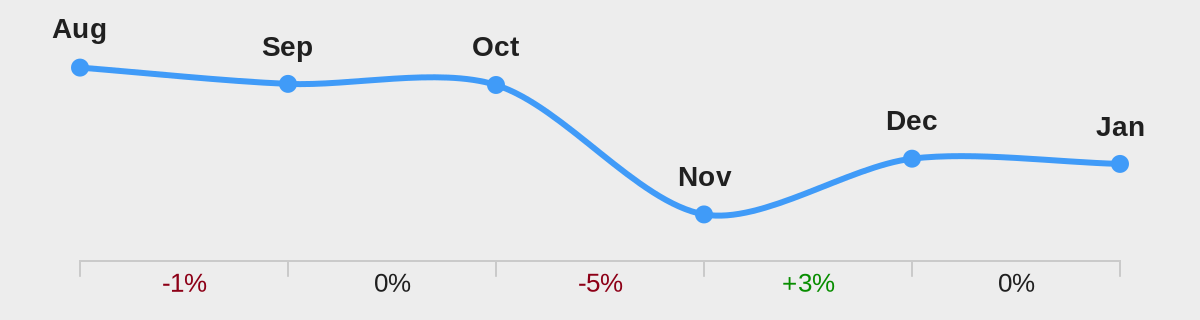
Average national wholesale values by month
Wholesale values declined slightly in January, but the decrease slowed from previous months.
Most Active Dealers
Based on number of vehicles sold
| 1 | CarMax - Norcross |
| 2 | CarMax - Town Center |
| 3 | CarMax - Southlake |
| 4 | CarMax - Lithia Springs |
| 5 | CarMax - Roswell |
| 6 | Southern Auto Solutions |
| 7 | Hardy Auto Resales |
| 8 | Krause Family Ford of Woodstock |
| 9 | AMS Vans |
| 10 | United BMW |
| 11 | Grand Motorcars Marietta |
| 12 | Paulding Chrysler Dodge Jeep Ram |
| 13 | Atlanta Toyota |
| 14 | Autonomous Auto Group |
| 15 | Atlanta Best Used Cars |
| 16 | BMW of Gwinnett Place |
| 17 | Hennessy Jaguar Atlanta |
| 18 | Stone Mountain Toyota |
| 19 | DriveTime - UNION CITY |
| 20 | Automax Atlanta |
| 21 | Hennessy Lexus Atlanta |
| 22 | Carma Auto Group |
| 23 | Hennessy Lexus Gwinnett |
| 24 | Calavan Kia West |
| 25 | Cobb County Toyota |
Most Active Independent Dealers
Based on number of vehicles sold by independent auto dealers
| 1 | Southern Auto Solutions |
| 2 | Hardy Auto Resales |
| 3 | AMS Vans |
| 4 | Grand Motorcars Marietta |
| 5 | Autonomous Auto Group |
| 6 | Atlanta Best Used Cars |
| 7 | Automax Atlanta |
| 8 | Carma Auto Group |
| 9 | Atlanta Autos |
| 10 | BMVW Auto Sales |
| 11 | 1st Choice Autos |
| 12 | Cherokee Auto Sales |
| 13 | Motorvation |
| 14 | North Georgia Auto Brokers |
| 15 | Malone's Automotive |
| 16 | Platinum Cars Alpharetta |
| 17 | Hennessy Auto |
| 18 | Pars Car Sales - Mt. Zion |
| 19 | Hola Auto Sales |
| 20 | JZ Auto Sales |
Retail Used Inventory Levels
Highest Demand Vehicles in Atlanta for January
Based on number of vehicles sold and average days on lot
| 1 | NISSAN ROGUE | Score: 96 |
| 2 | TOYOTA CAMRY | Score: 96 |
| 3 | TOYOTA RAV4 | Score: 93 |
| 4 | LEXUS RX 350 | Score: 93 |
| 5 | TOYOTA COROLLA | Score: 93 |
| 6 | HYUNDAI TUCSON | Score: 92 |
| 7 | LEXUS ES 350 | Score: 89 |
| 8 | NISSAN SENTRA | Score: 89 |
| 9 | JEEP CHEROKEE | Score: 89 |
| 10 | HONDA ACCORD | Score: 89 |
| 11 | AUDI Q5 | Score: 88 |
| 12 | CHEVROLET SILVERADO | Score: 88 |
| 13 | FORD ESCAPE | Score: 88 |
| 14 | RAM 1500 | Score: 88 |
| 15 | MERCEDES-BENZ GLC-CLASS | Score: 87 |
| 16 | HYUNDAI SONATA | Score: 87 |
| 17 | JEEP COMPASS | Score: 87 |
| 18 | KIA OPTIMA | Score: 87 |
| 19 | NISSAN ALTIMA | Score: 86 |
| 20 | HYUNDAI ELANTRA | Score: 86 |
| 21 | MAZDA CX-5 | Score: 86 |
| 22 | CHEVROLET MALIBU | Score: 85 |
| 23 | HONDA CR-V | Score: 85 |
| 24 | FORD FUSION | Score: 84 |
| 25 | KIA SOUL | Score: 84 |
Lowest Days on Lot Vehicles
Based on average days on lot for January
| 1 | HYUNDAI TUCSON | 21.5 days |
| 2 | JEEP CHEROKEE | 22.4 days |
| 3 | LEXUS RX 350 | 23.1 days |
| 4 | NISSAN ROGUE | 23.1 days |
| 5 | MERCEDES-BENZ GLC-CLASS | 23.3 days |
| 6 | LEXUS ES 350 | 23.8 days |
| 7 | JEEP COMPASS | 24.0 days |
| 8 | AUDI Q5 | 24.1 days |
| 9 | NISSAN SENTRA | 25.0 days |
| 10 | TOYOTA RAV4 | 25.2 days |
| 11 | KIA OPTIMA | 25.4 days |
| 12 | KIA SOUL | 25.9 days |
| 13 | FORD ESCAPE | 25.9 days |
| 14 | MAZDA CX-5 | 26.6 days |
| 15 | RAM 1500 | 26.8 days |
| 16 | LAND ROVER RANGE ROVER SPORT | 27.3 days |
| 17 | FORD FUSION | 27.6 days |
| 18 | CHEVROLET MALIBU | 27.7 days |
| 19 | SUBARU OUTBACK | 28.0 days |
| 20 | HYUNDAI SONATA | 28.4 days |
| 21 | VOLKSWAGEN TIGUAN | 28.6 days |
| 22 | TOYOTA TACOMA | 28.8 days |
| 23 | KIA FORTE | 28.8 days |
| 24 | TOYOTA COROLLA | 29.3 days |
| 25 | HONDA CR-V | 29.3 days |
Days on Lot Trend in the Atlanta Region
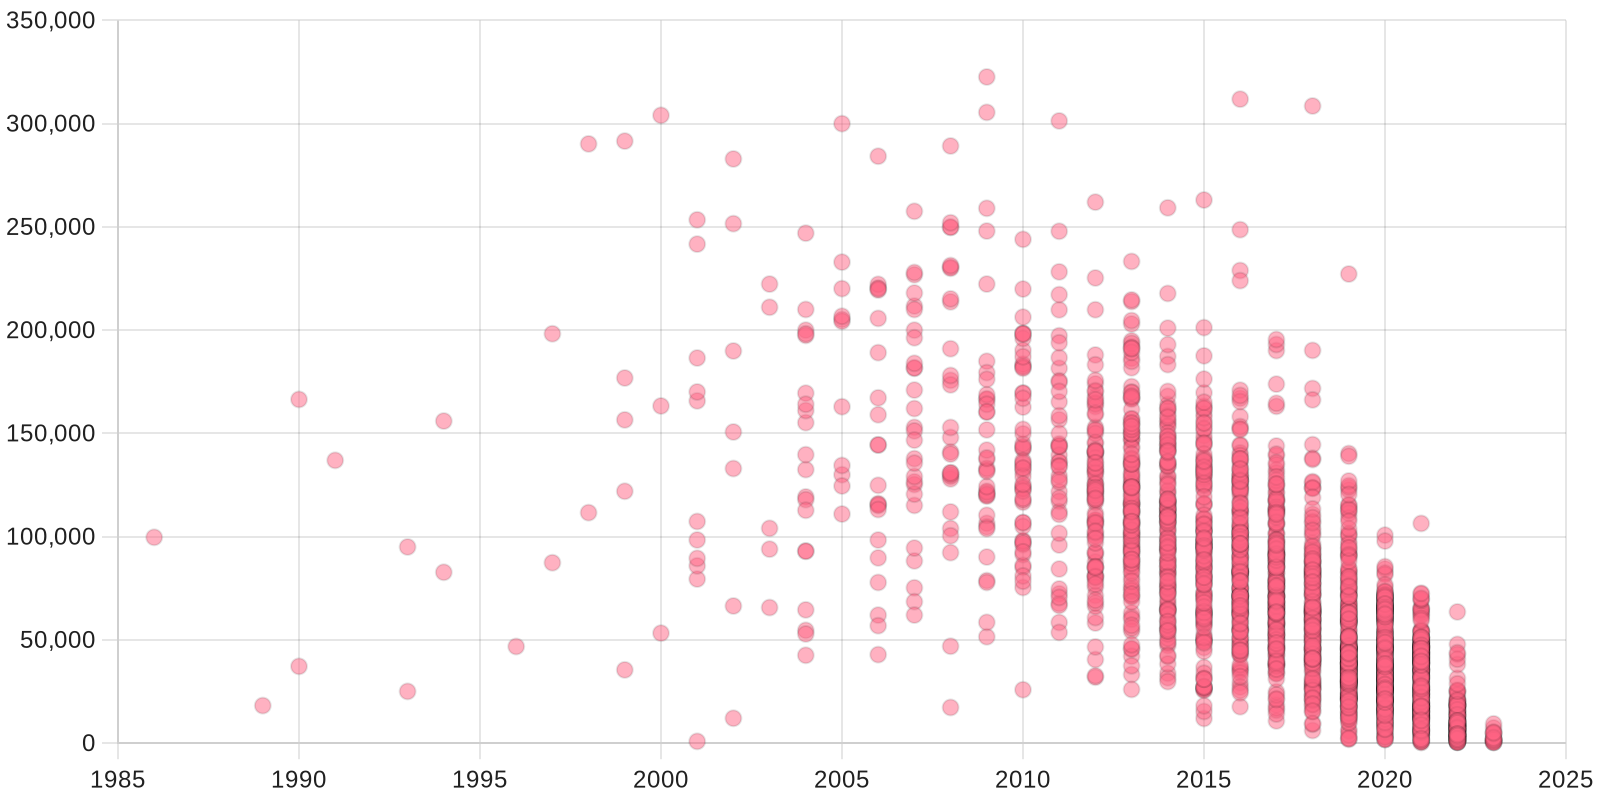
January Used Inventory by Year and Mileage
All vehicles for sale in Atlanta