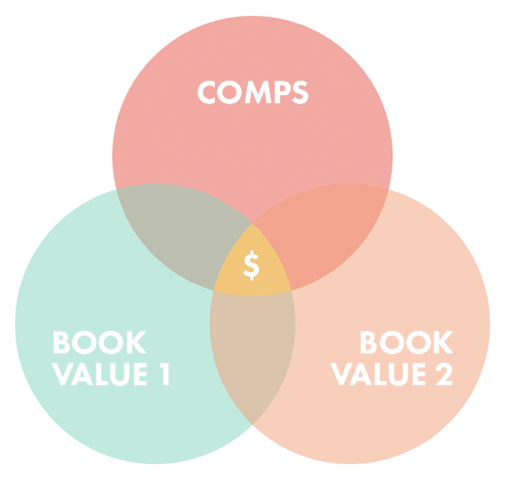
Source Triangulation
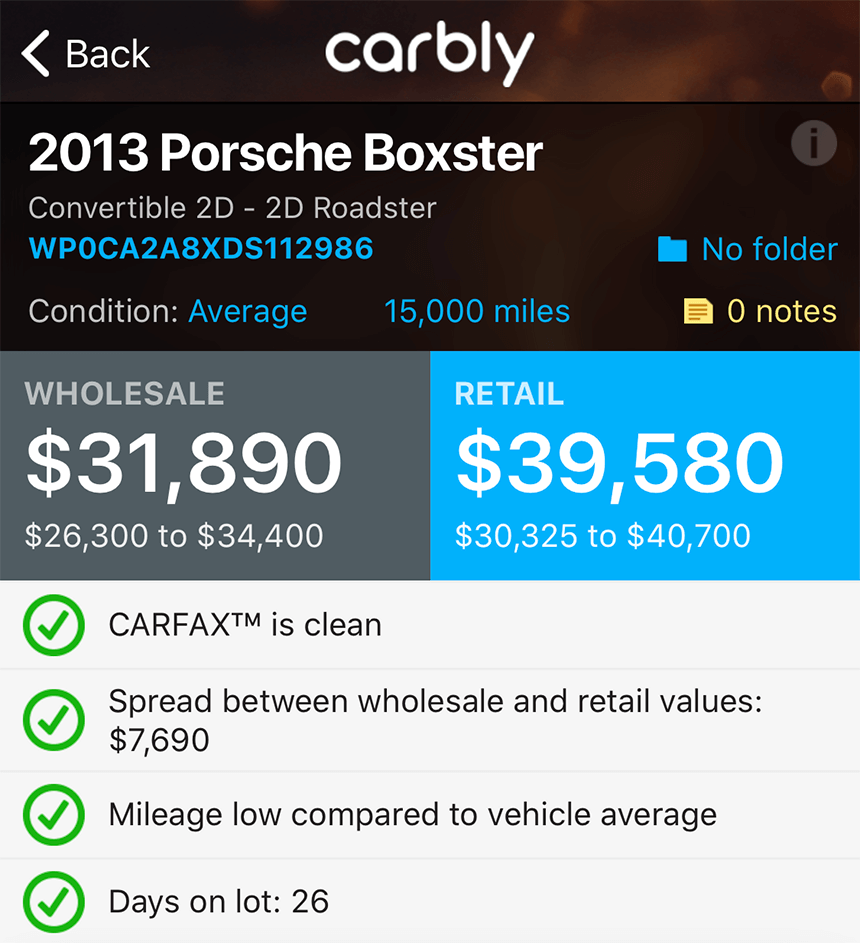
Triangulating the 3 main sources of data for vehicle valuations is critical because it accounts for all aspects of the market. Limiting yourself to one source when valuing a vehicle leaves you with huge blind spots and vastly increases the likelihood of taking a loss on a deal.
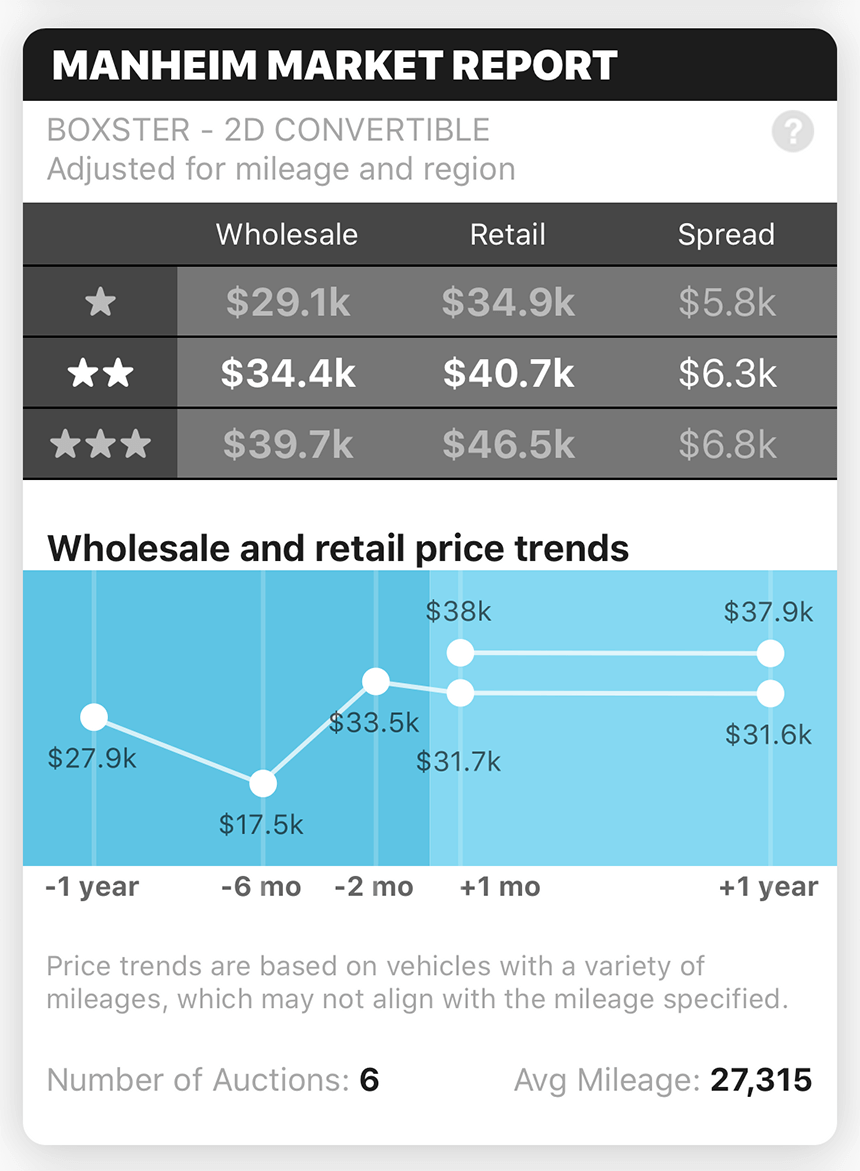
Book Values
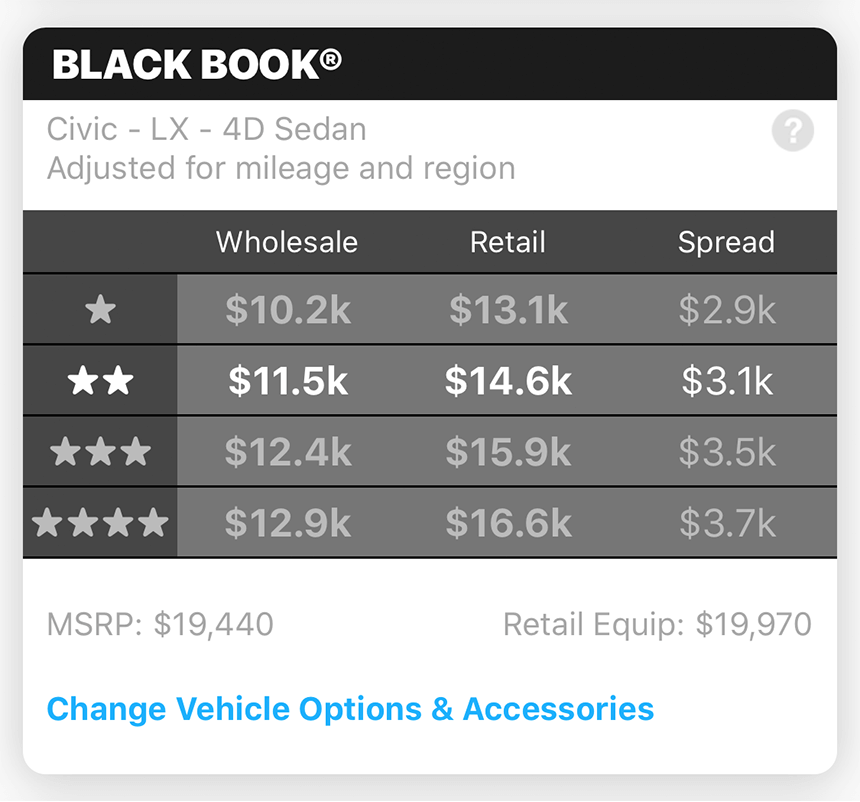
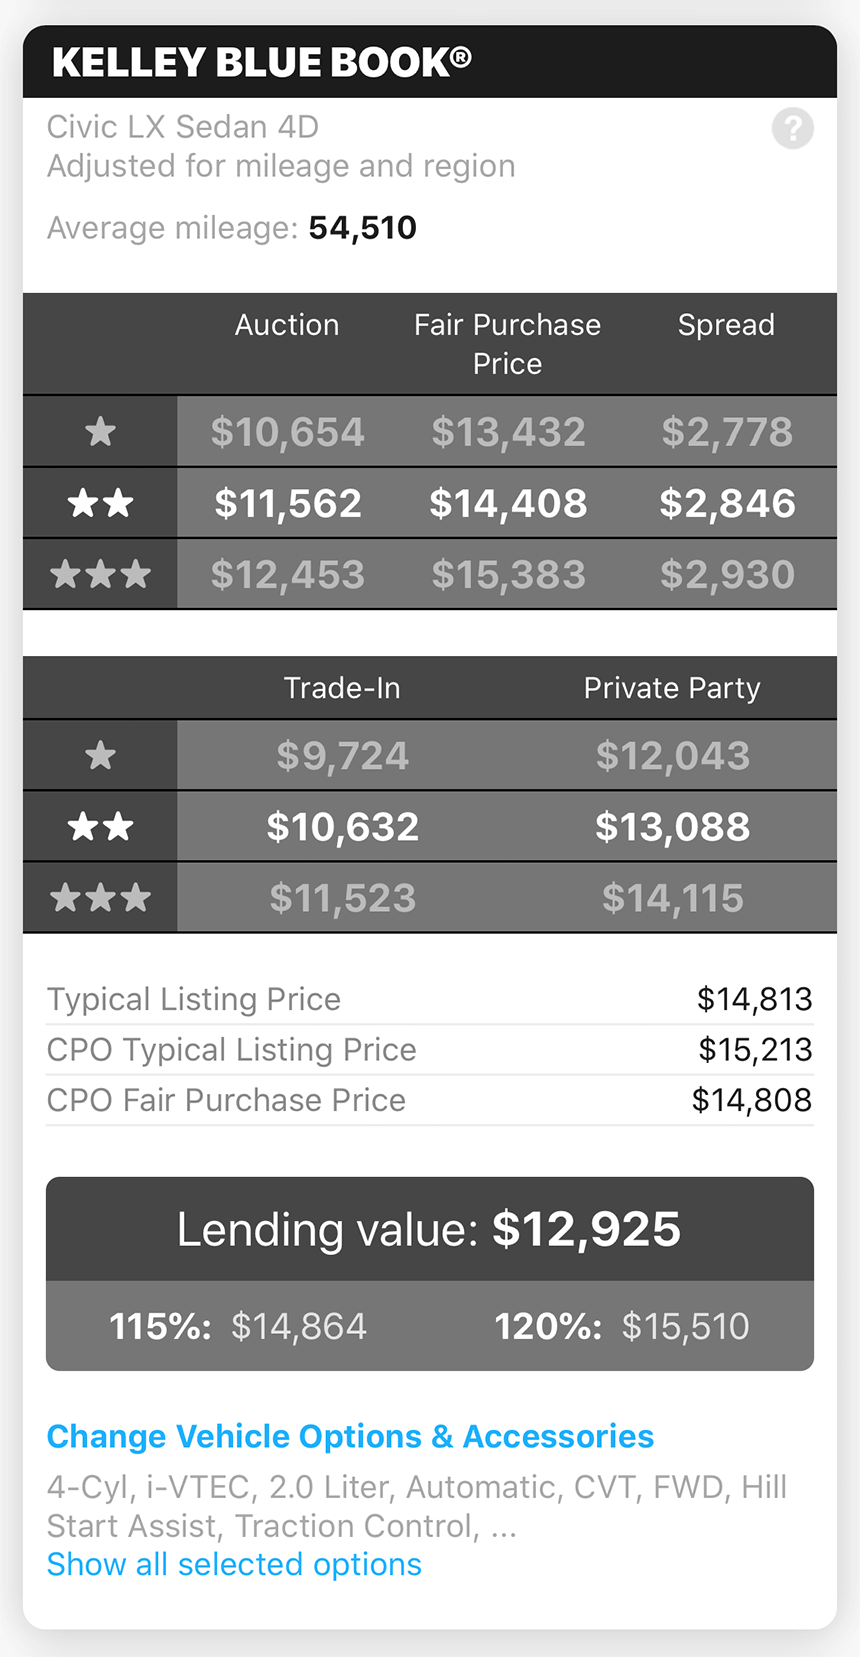
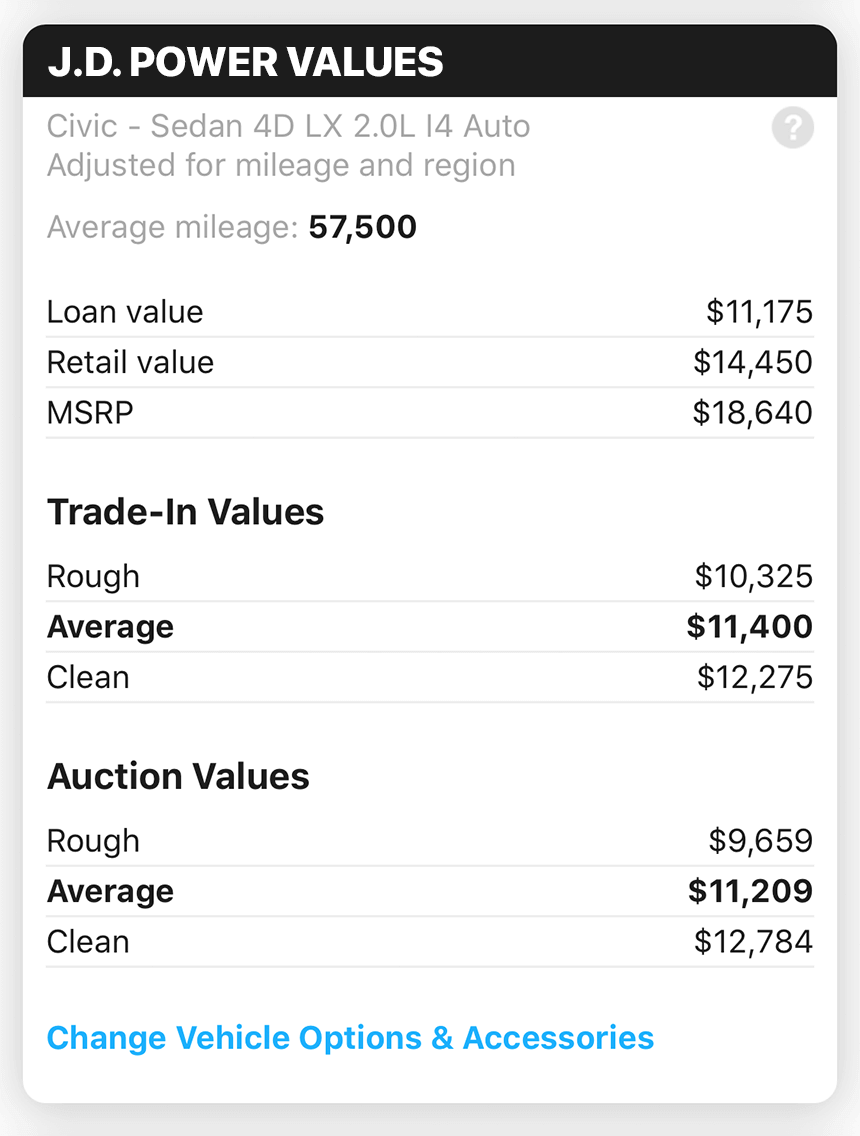
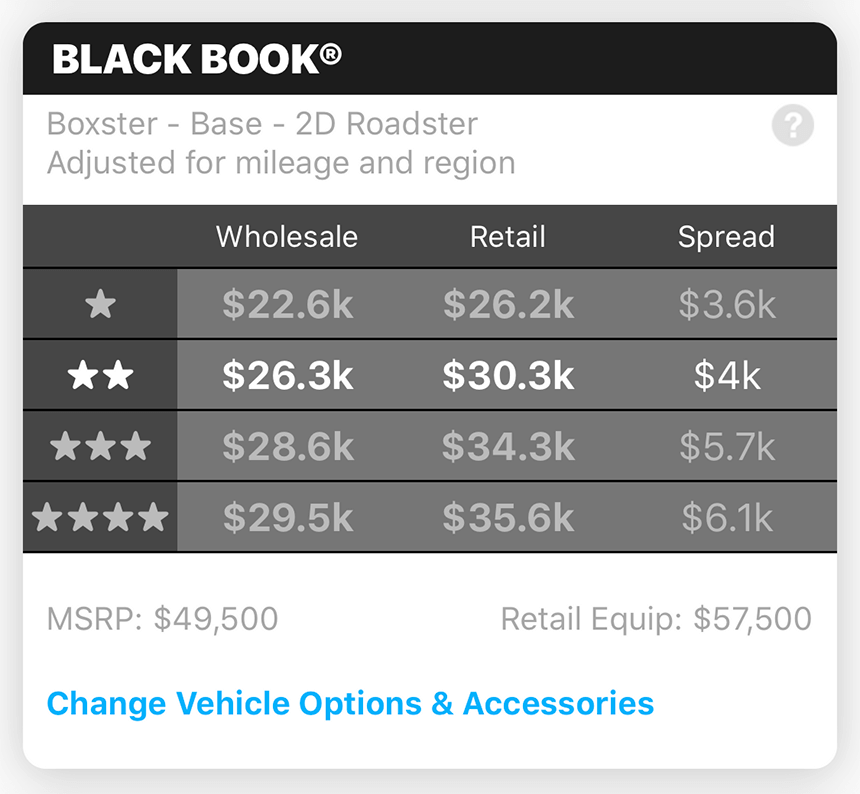
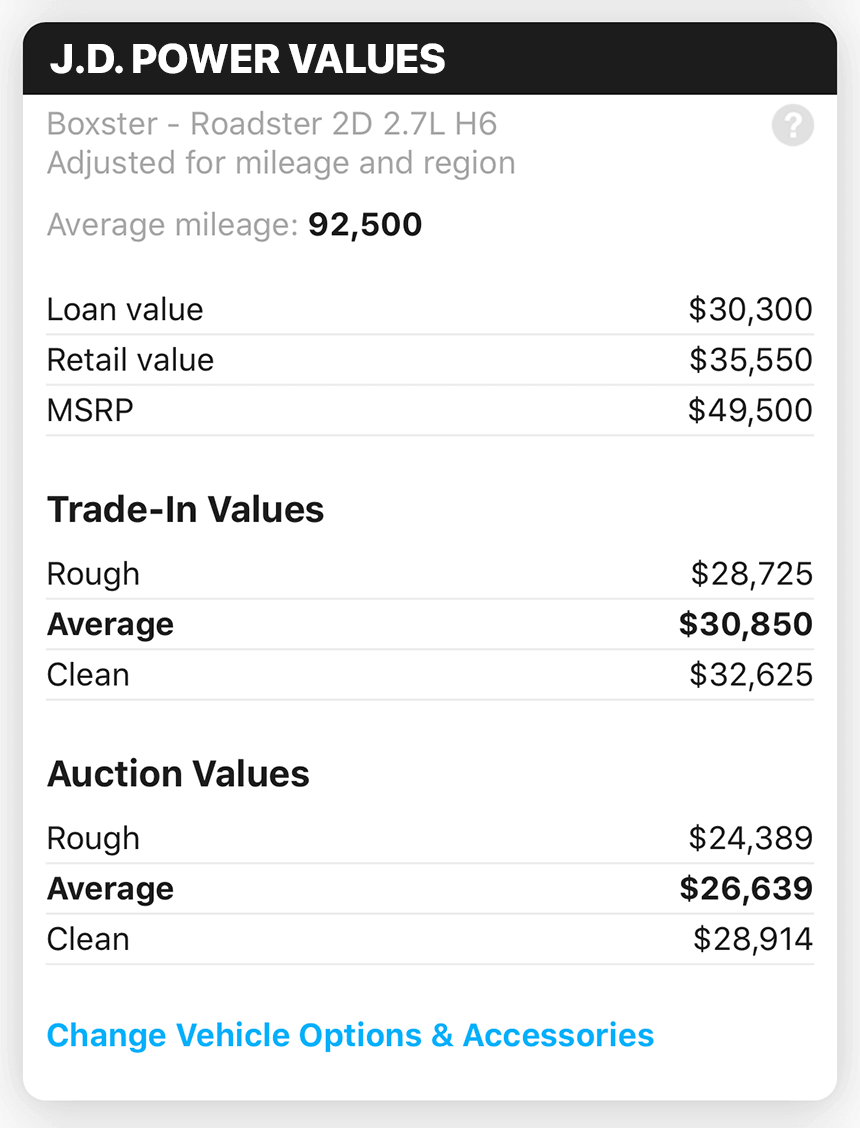
Book providers such as J.D. Power and Black Book® provide an incredibly valuable service. They are able to abstract away much of the complexity and give individuals a baseline for determining values.
While these book value providers are essential to determining price, there is often significant variation between the numbers they provide. Our valuation method involves cross-checking at least 2 of these appraisal sources to determine how reliable the data actually is.
While these providers are valuable, they represent only one dimension to the solution, as they don't often fully reflect market variables. We'll see a few examples of this shortly.
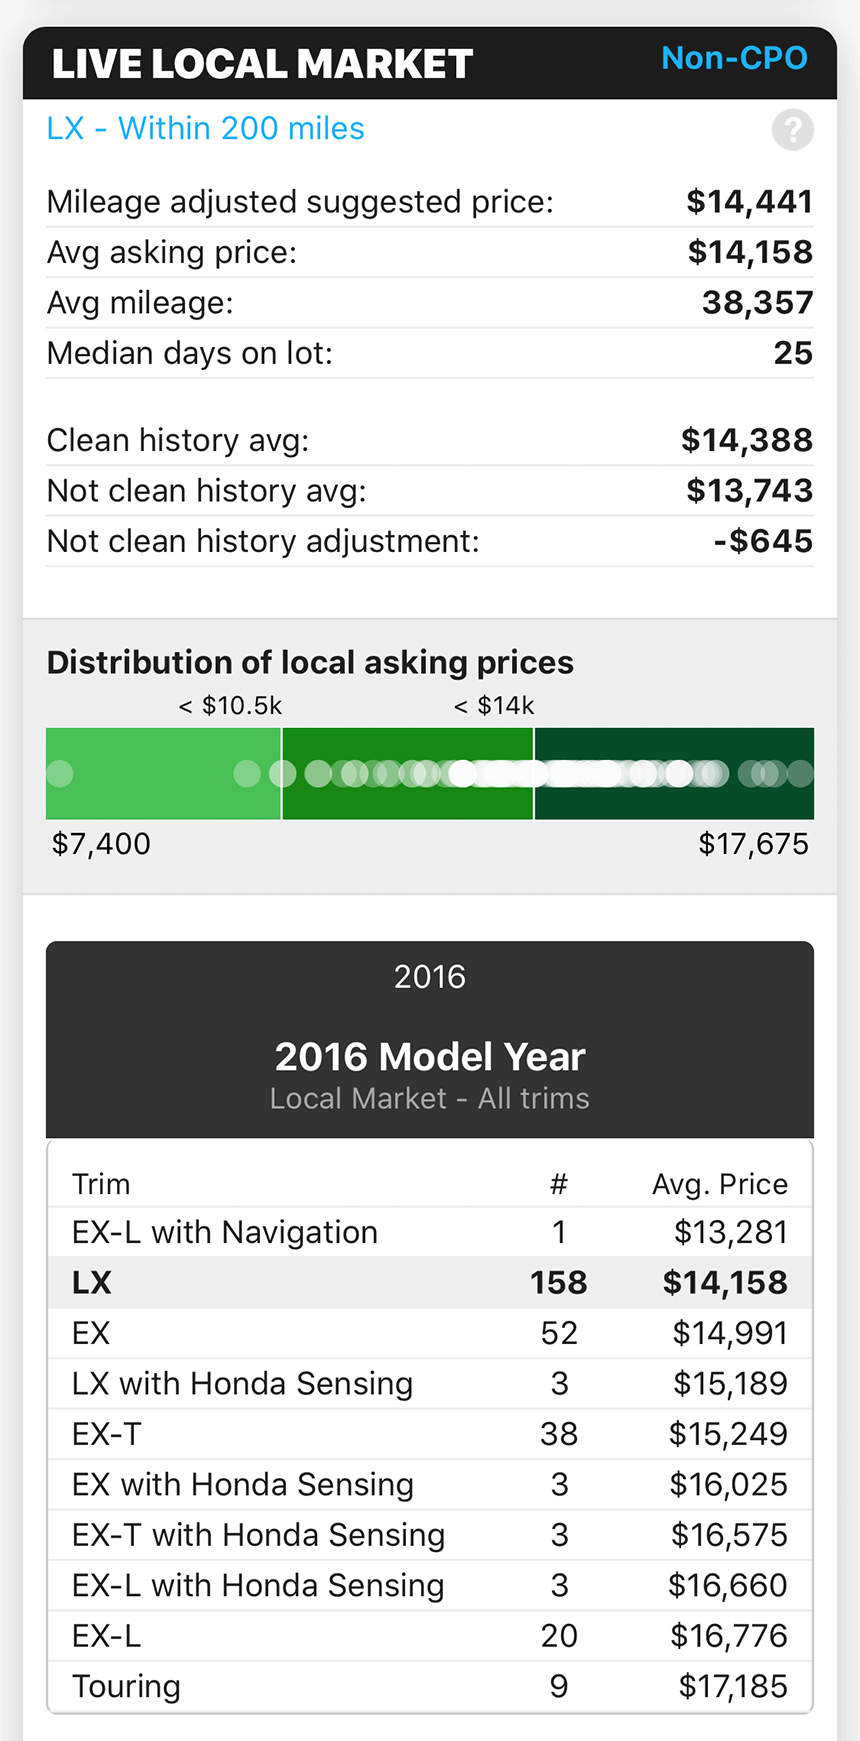
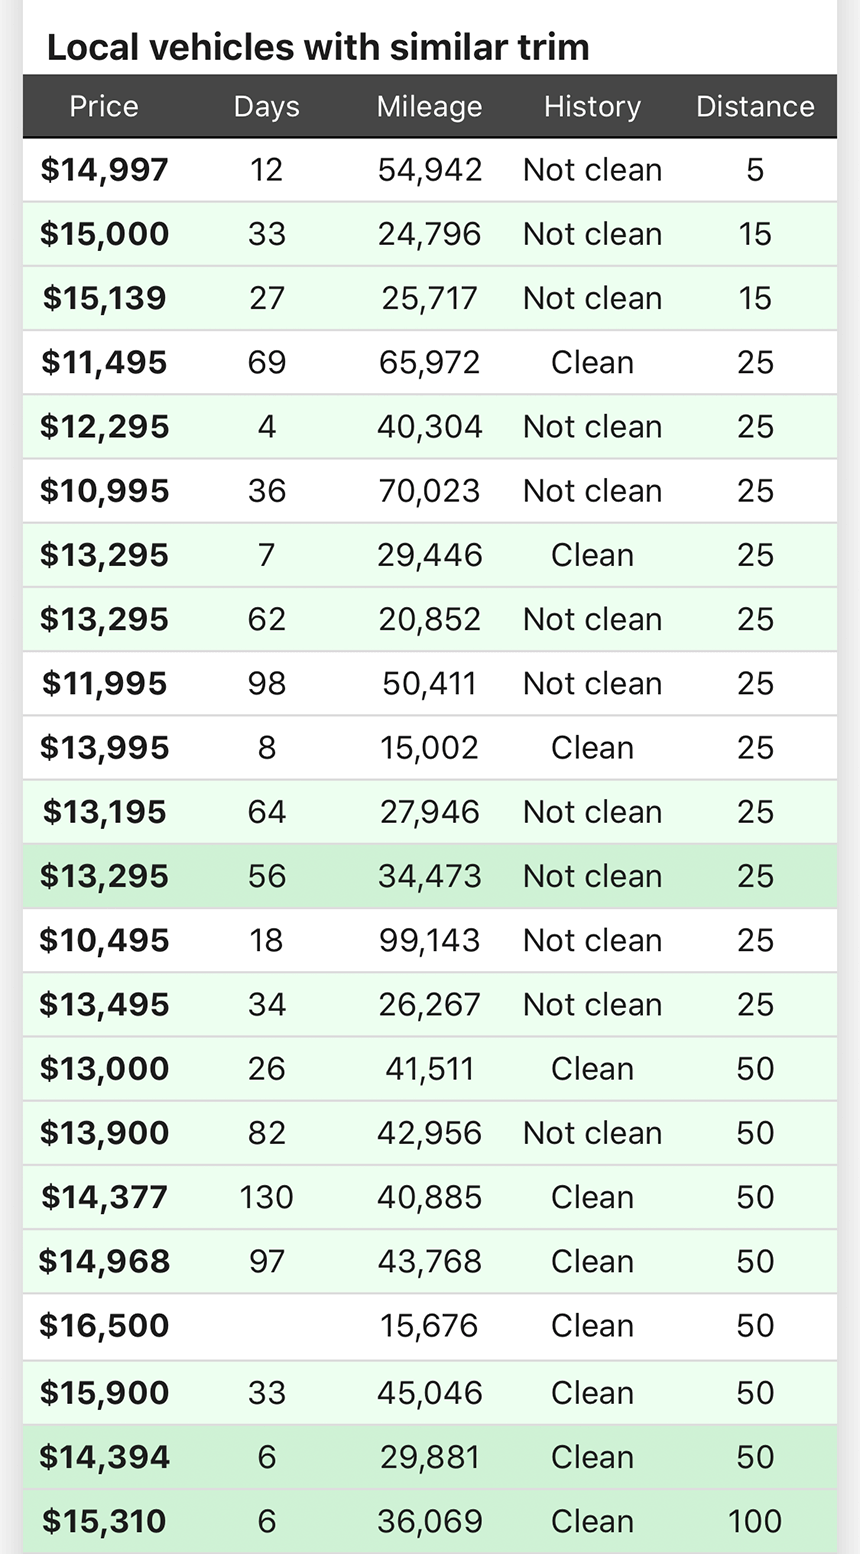
Comps
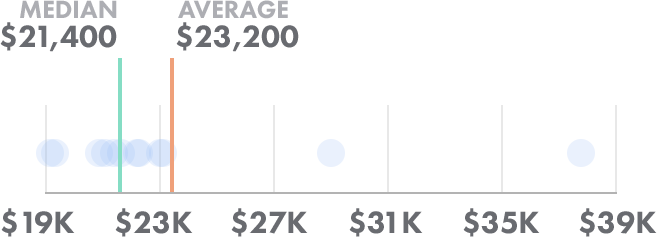
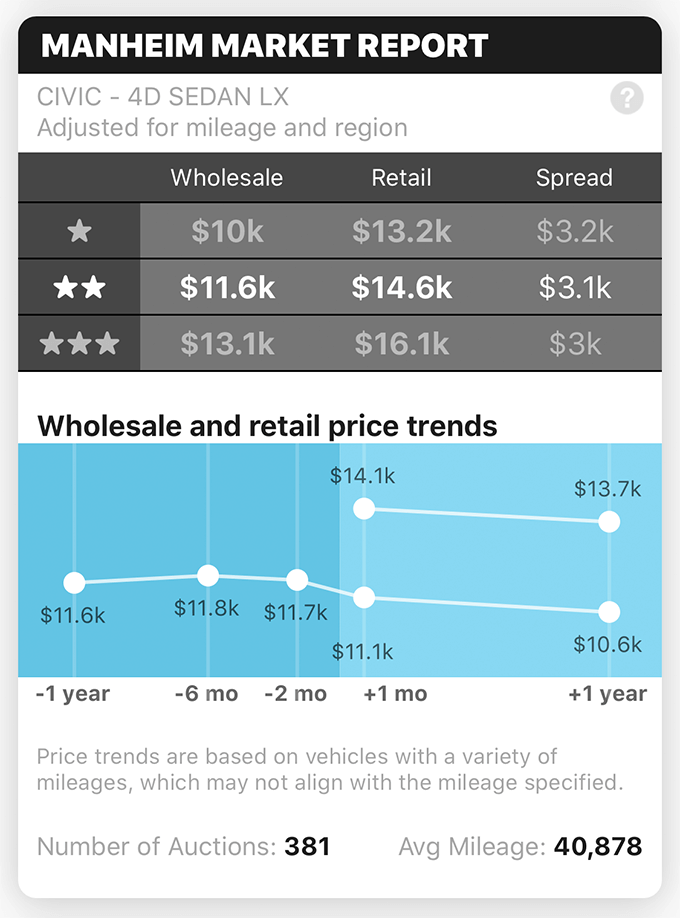
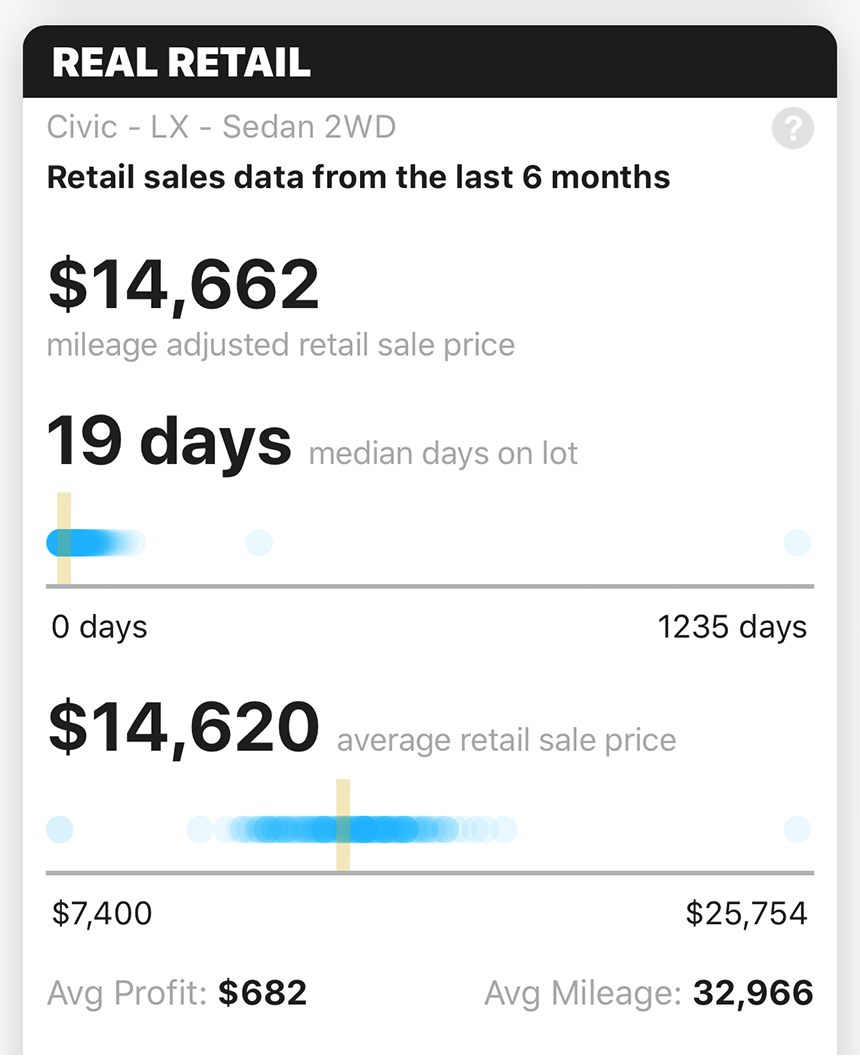
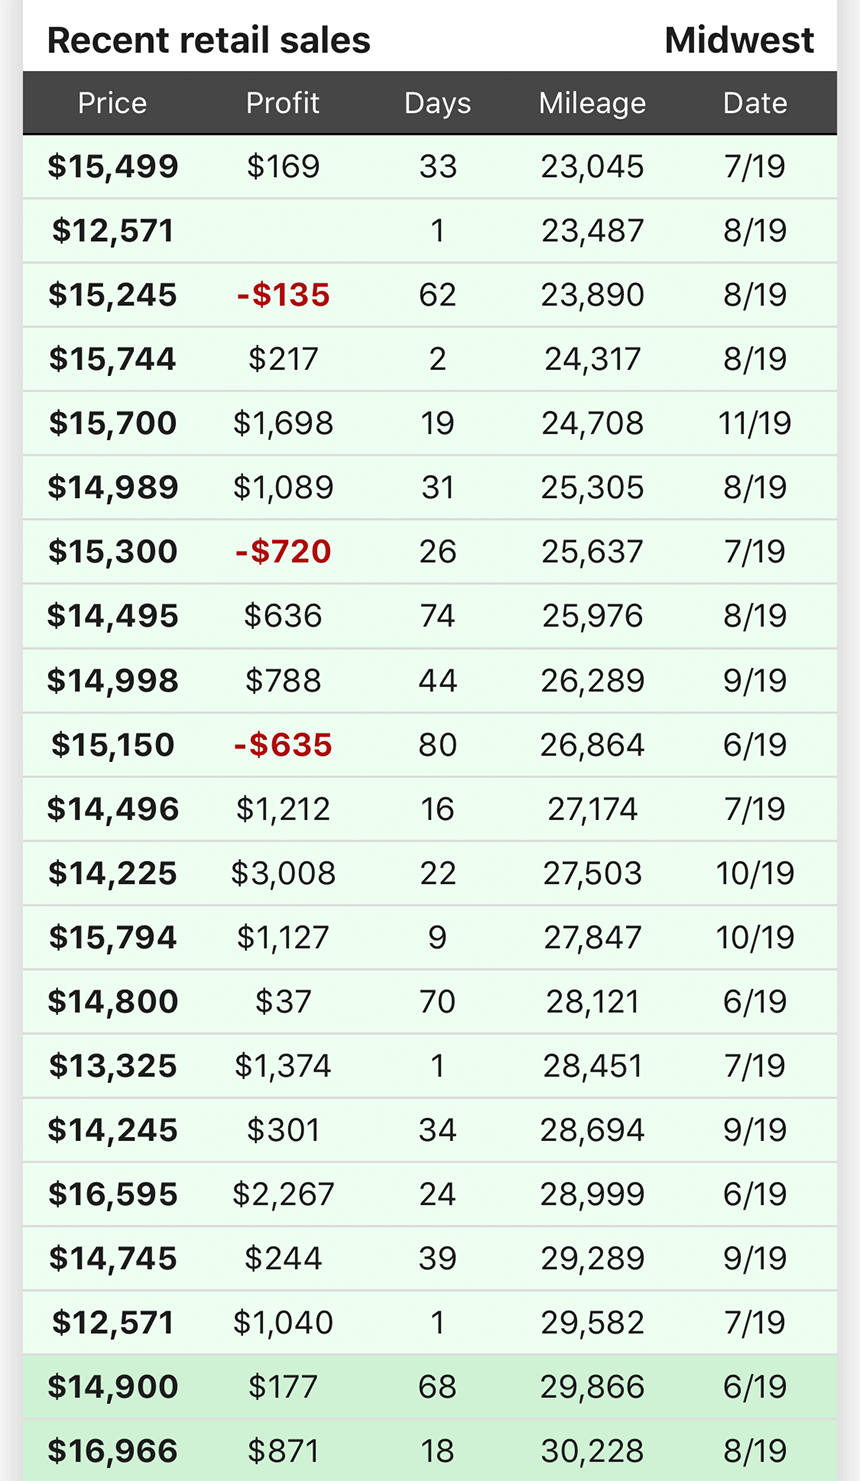
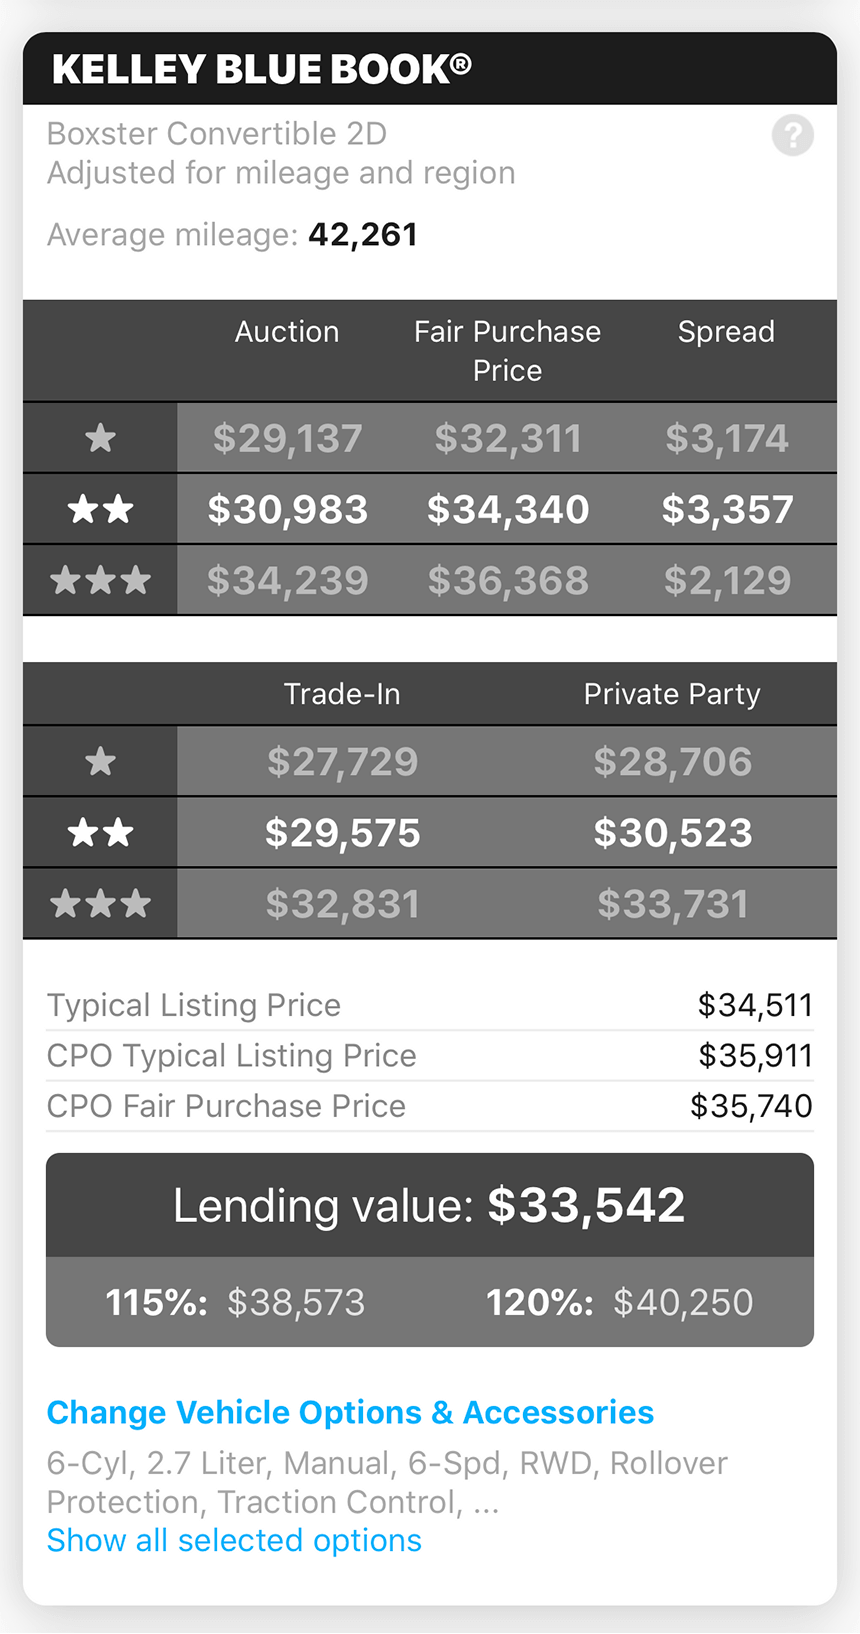
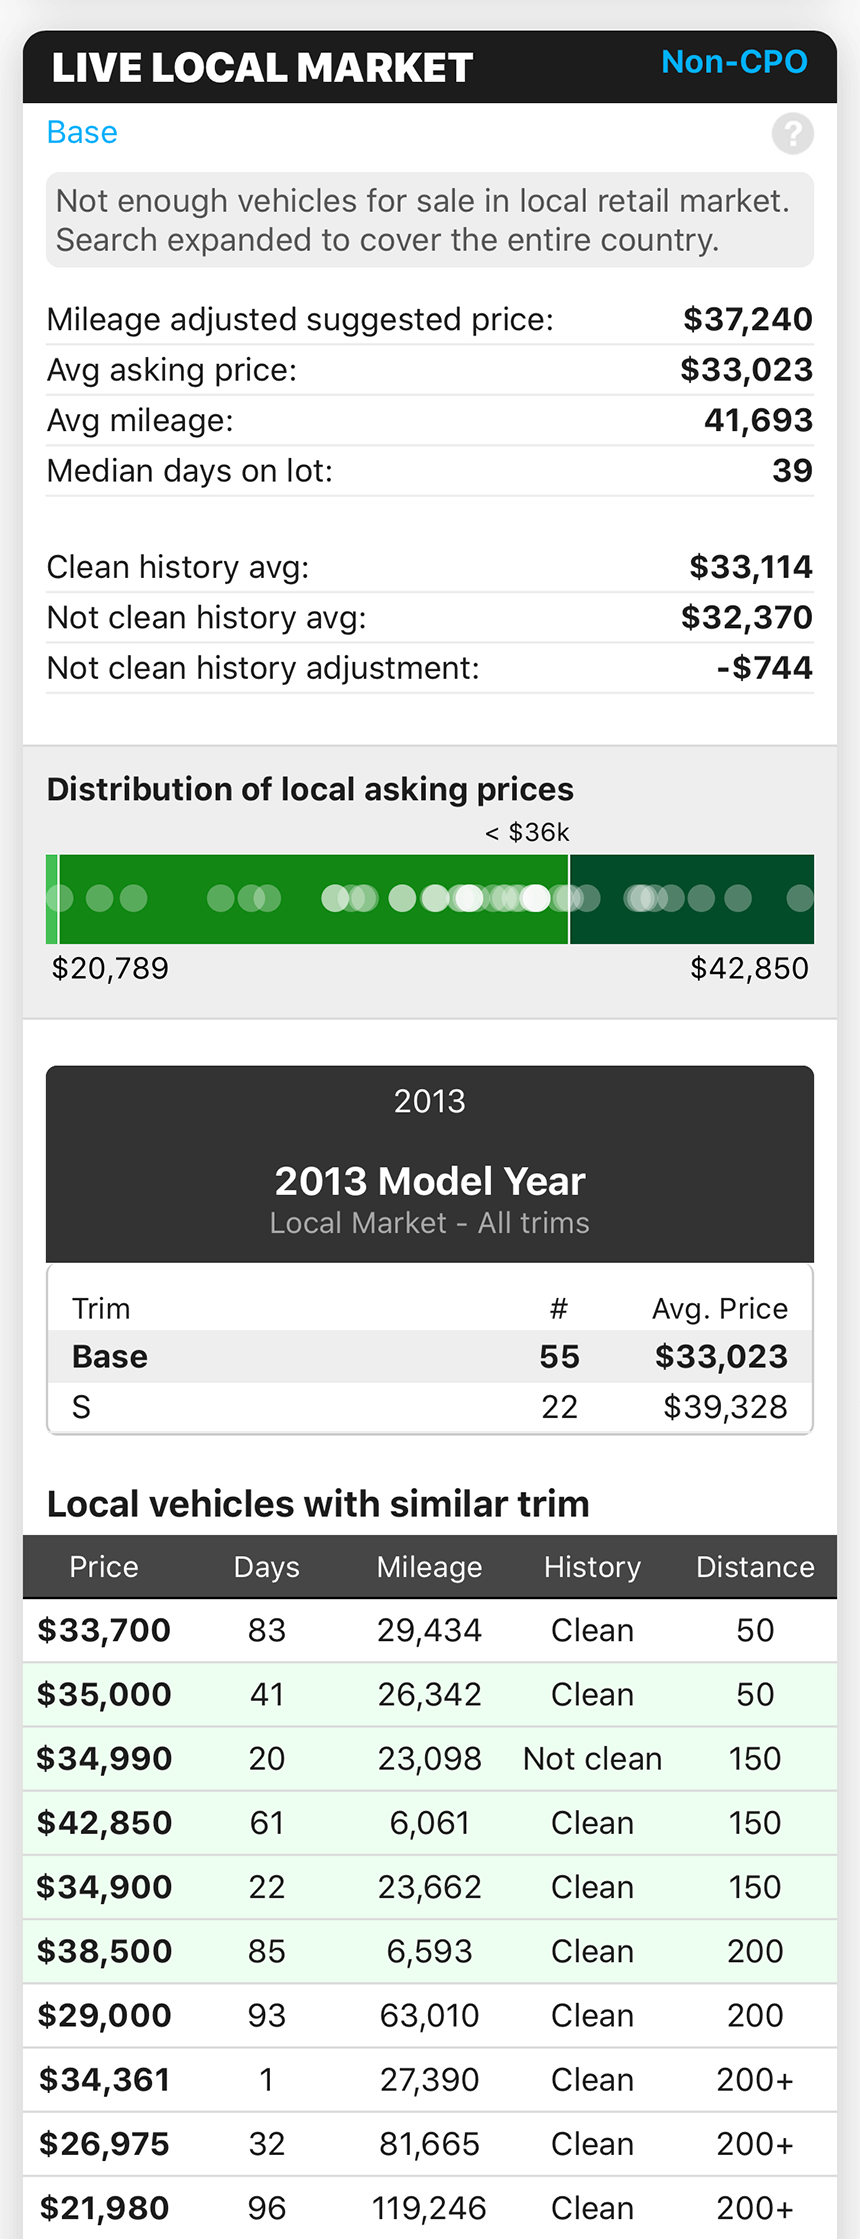
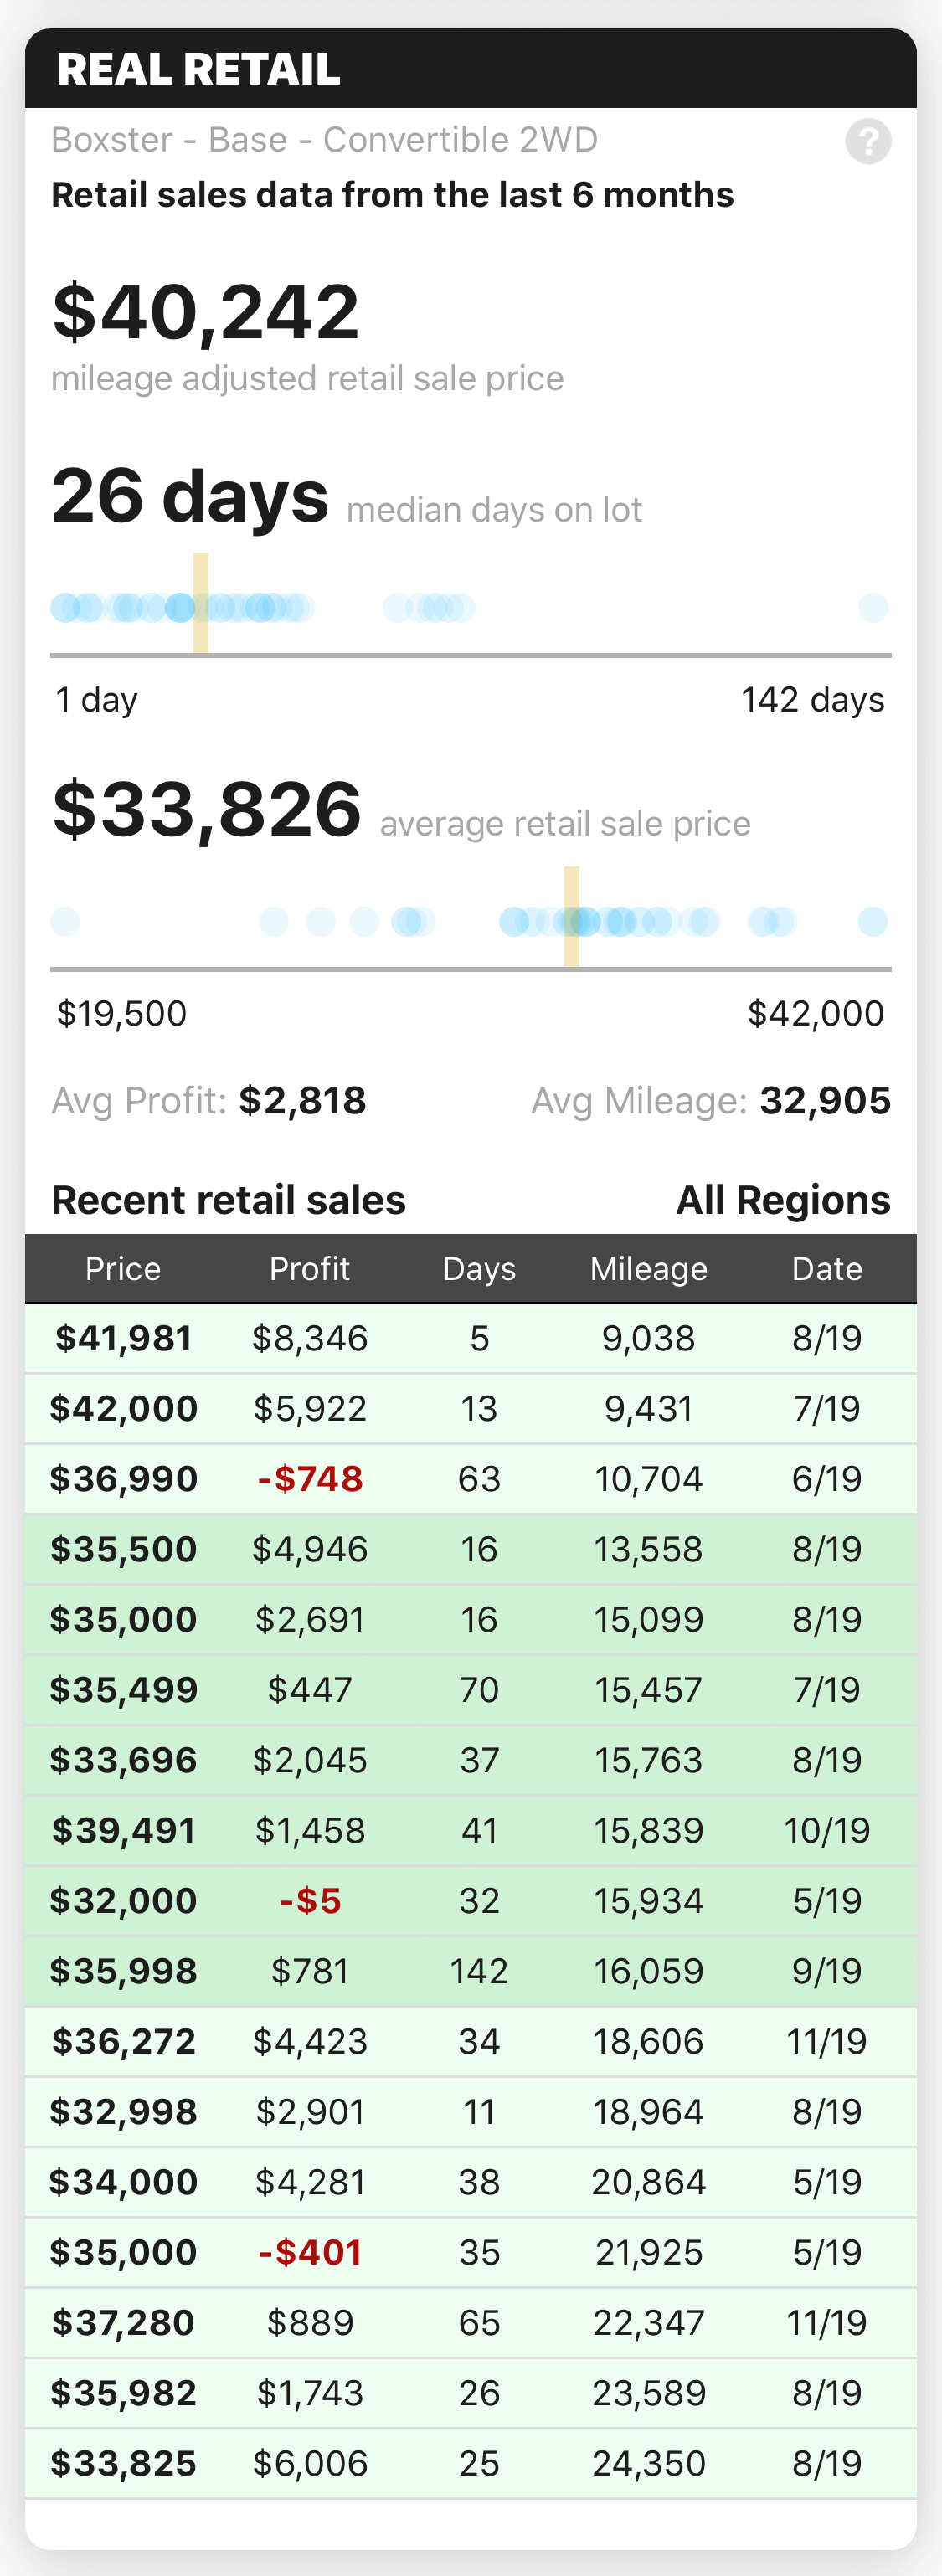
The retail market is the last piece of the puzzle when it comes to determining value. It's the ultimate ceiling on what a vehicle is worth once it reaches the end buyer. Overestimate this number and you can quickly find yourself upside down. Underestimate it and you'll miss the mark at wholesale or leave money on the table at retail. Just like we do with guide books, Carbly recommends multiple data points when assessing the retail market.
Historical sale comps are the best way to predict what the market will do next. Carbly provides actual historical retail transactions from almost 50% of dealers in the country, so you know what to expect out of a vehicle. To avoid being caught out in an ever fluctuating market though, it's equally important to understand live, local comps. Carbly performs in-depth analysis so you can quickly compare historical indicators to the live local market.