Baltimore Region Used Car Market Report
January 2023
Used car sales trends for Baltimore and surrounding communities
January market trends based on used inventory from 282 dealers in the Baltimore region.
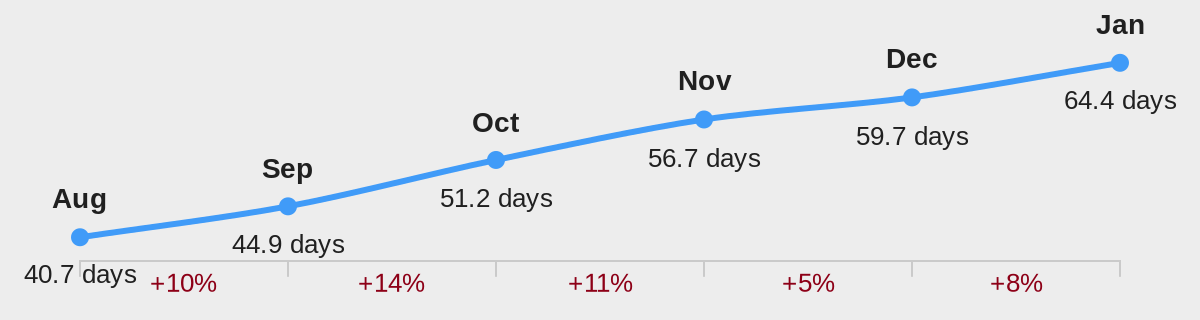
64.4 days
Average turn
Up 7.9%
35.4 days
Average vehicles sold per dealer
Down 6.5%

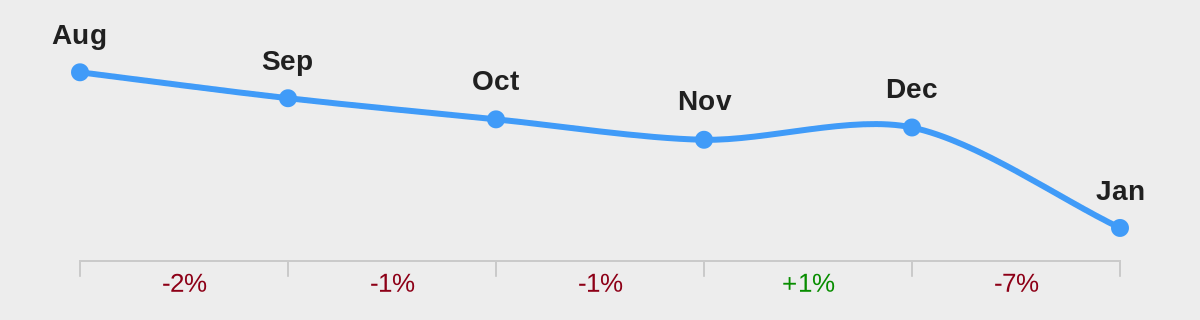
Average national wholesale values by month
Wholesale values declined slightly in January, but the decrease slowed from previous months.
Most Active Dealers
Based on number of vehicles sold
| 1 | CarMax - Laurel |
| 2 | CarMax - White Marsh |
| 3 | Jones Used Cars |
| 4 | Heritage | MileOne Autogroup |
| 5 | ANYONERIDES.COM |
| 6 | CarMax - Ellicott City |
| 7 | MileOne Autogroup |
| 8 | Koons Ford Of Baltimore |
| 9 | Koons White Marsh Chevrolet |
| 10 | Antwerpen Nissan Security |
| 11 | Len Stoler Lexus |
| 12 | Heritage Honda |
| 13 | Koons Annapolis Toyota |
| 14 | Koons Kia of Owings Mills |
| 15 | Koons Clarksville Chevrolet Buick GMC |
| 16 | Sheehy Toyota of Laurel |
| 17 | J.B.A. CHEVROLET |
| 18 | Lexus of Towson |
| 19 | Car Corporation of Millersville |
| 20 | Len Stoler Hyundai |
| 21 | Tate Dodge Chrysler Jeep, Inc. |
| 22 | Sheehy Nissan Glen Burnie |
| 23 | Bob Bell Hyundai |
| 24 | Sheehy Lexus of Annapolis |
| 25 | MINI of Annapolis |
Most Active Independent Dealers
Based on number of vehicles sold by independent auto dealers
| 1 | Jones Used Cars |
| 2 | Heritage | MileOne Autogroup |
| 3 | ANYONERIDES.COM |
| 4 | MileOne Autogroup |
| 5 | Car Corporation of Millersville |
| 6 | Jones Junction |
| 7 | Auto Showcase of Bel Air |
| 8 | All Roads |
| 9 | East Coast Automotive Inc. |
| 10 | Jimmy The Boxer Auto Mall |
| 11 | Arm Motors |
| 12 | Priceless |
| 13 | Dawsons Auto & Cycle |
| 14 | High Rated Auto Company |
| 15 | Sir Michaels Auto Sales - Rosedale |
| 16 | Sports and Imports |
| 17 | A G Auto Sales |
| 18 | Bill Kidd's |
| 19 | M&M Auto Baltimore |
| 20 | Star Cars LLC |
Retail Used Inventory Levels
Highest Demand Vehicles in Baltimore for January
Based on number of vehicles sold and average days on lot
| 1 | TOYOTA RAV4 | Score: 105 |
| 2 | HONDA CR-V | Score: 101 |
| 3 | HONDA CIVIC | Score: 94 |
| 4 | TOYOTA COROLLA | Score: 91 |
| 5 | LEXUS RX 350 | Score: 91 |
| 6 | TOYOTA CAMRY | Score: 91 |
| 7 | HONDA ODYSSEY | Score: 89 |
| 8 | HONDA PILOT | Score: 88 |
| 9 | TOYOTA HIGHLANDER | Score: 87 |
| 10 | FORD F-150 | Score: 85 |
| 11 | CHEVROLET SILVERADO | Score: 84 |
| 12 | JEEP GRAND CHEROKEE | Score: 83 |
| 13 | TOYOTA TACOMA | Score: 83 |
| 14 | HONDA ACCORD | Score: 80 |
| 15 | MAZDA CX-5 | Score: 80 |
| 16 | RAM 1500 | Score: 79 |
| 17 | SUBARU OUTBACK | Score: 78 |
| 18 | VOLKSWAGEN JETTA | Score: 78 |
| 19 | HYUNDAI SANTA FE | Score: 76 |
| 20 | JEEP CHEROKEE | Score: 72 |
| 21 | HYUNDAI ELANTRA | Score: 68 |
| 22 | HYUNDAI TUCSON | Score: 68 |
| 23 | NISSAN ROGUE | Score: 66 |
| 24 | FORD EXPLORER | Score: 64 |
| 25 | FORD ESCAPE | Score: 55 |
Lowest Days on Lot Vehicles
Based on average days on lot for January
| 1 | TOYOTA RAV4 | 22.9 days |
| 2 | LEXUS RX 350 | 23.8 days |
| 3 | HONDA ODYSSEY | 25.0 days |
| 4 | HONDA CR-V | 25.6 days |
| 5 | HONDA PILOT | 26.7 days |
| 6 | TOYOTA COROLLA | 30.3 days |
| 7 | TOYOTA TACOMA | 30.9 days |
| 8 | TOYOTA HIGHLANDER | 31.4 days |
| 9 | HONDA CIVIC | 32.4 days |
| 10 | MAZDA CX-5 | 33.8 days |
| 11 | SUBARU OUTBACK | 33.8 days |
| 12 | VOLKSWAGEN JETTA | 33.8 days |
| 13 | FORD F-150 | 34.7 days |
| 14 | RAM 1500 | 36.1 days |
| 15 | CHEVROLET SILVERADO | 36.4 days |
| 16 | TOYOTA CAMRY | 36.7 days |
| 17 | HYUNDAI SANTA FE | 37.2 days |
| 18 | JEEP GRAND CHEROKEE | 37.5 days |
| 19 | JEEP CHEROKEE | 40.7 days |
| 20 | HYUNDAI TUCSON | 43.8 days |
| 21 | HONDA ACCORD | 48.7 days |
| 22 | FORD EXPLORER | 50.5 days |
| 23 | HYUNDAI ELANTRA | 51.4 days |
| 24 | NISSAN ROGUE | 51.8 days |
| 25 | FORD ESCAPE | 58.1 days |
Days on Lot Trend in the Baltimore Region
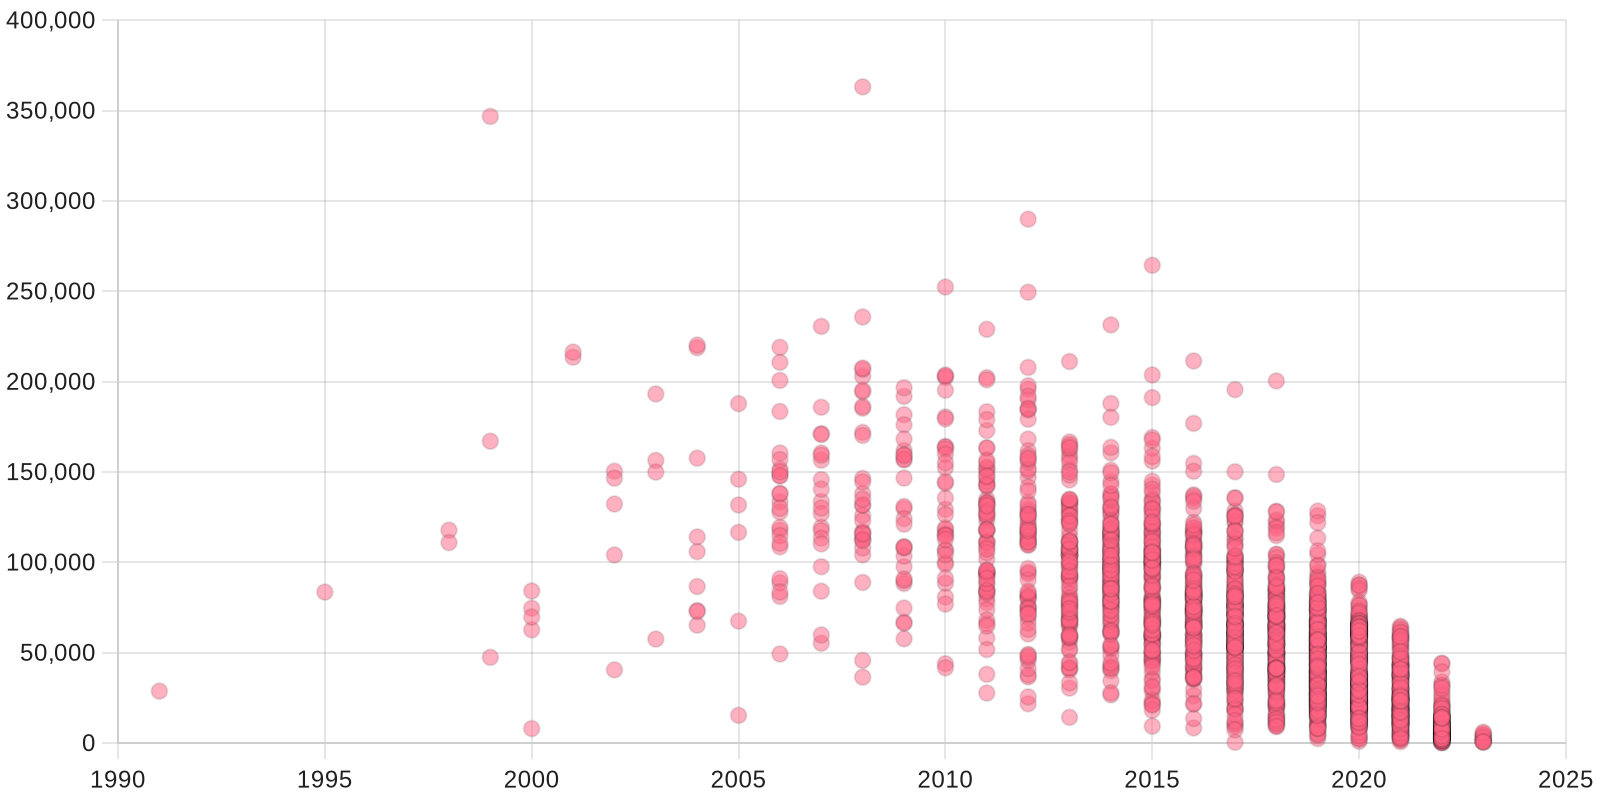
January Used Inventory by Year and Mileage
All vehicles for sale in Baltimore