Boston Region Used Car Market Report
December 2022
Used car sales trends for Boston and surrounding communities
December market trends based on used inventory from 547 dealers in the Boston region.
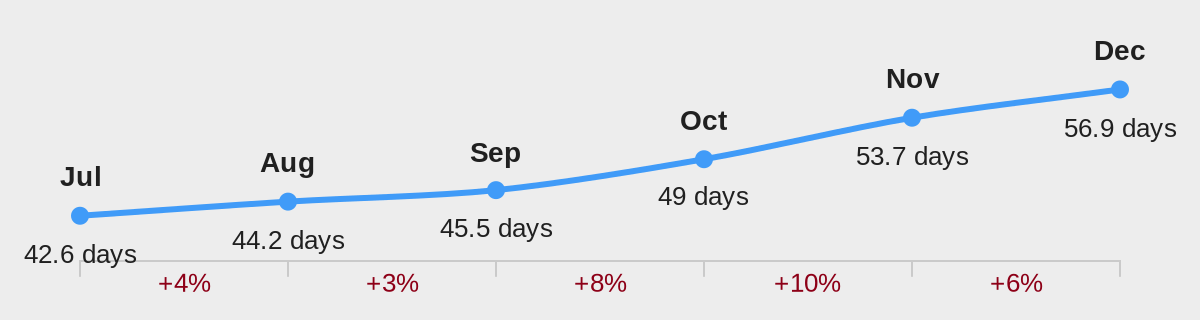
56.9 days
Average turn
Up 6.0%
35.4 days
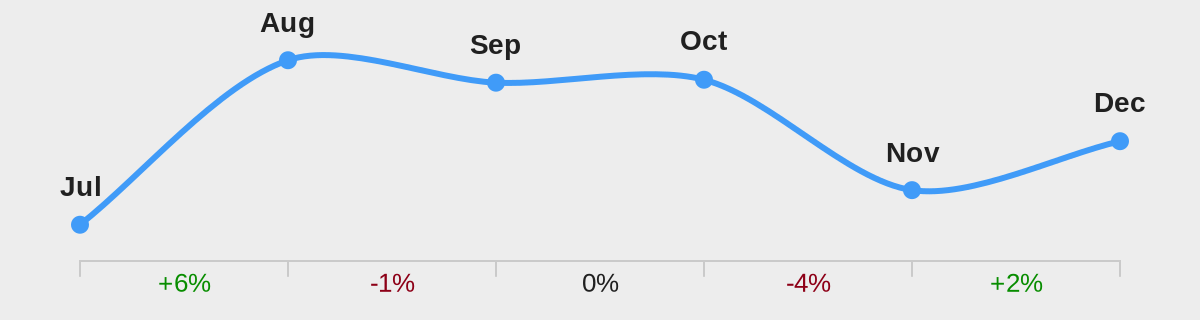
Average vehicles sold per dealer
Up 0.7%
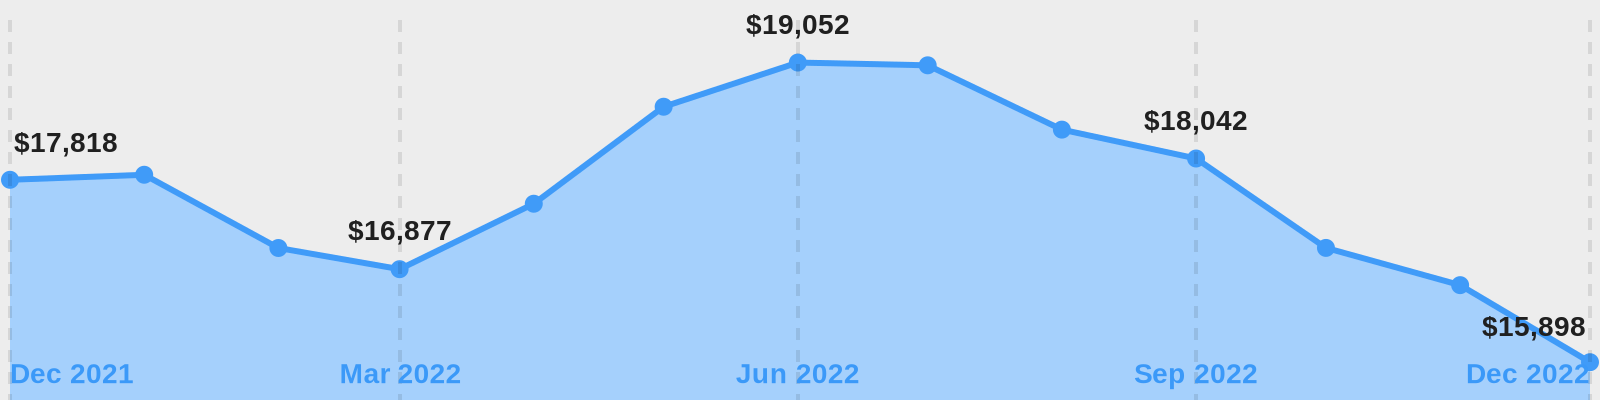
Average national wholesale values by month
Wholesale values continued their decline in December. Average wholesale values are down 5% nationally from November.
Most Active Dealers
Based on number of vehicles sold
| 1 | The Herb Chambers Companies |
| 2 | McGovern Automotive Group |
| 3 | CarMax - Westborough |
| 4 | CarMax - Norwood |
| 5 | CarMax - Danvers |
| 6 | 24 Auto Group |
| 7 | AutoMax Preowned |
| 8 | Imperial Cars |
| 9 | Bourne's Auto Center |
| 10 | Jaguar Norwood |
| 11 | Albrecht Auto Group |
| 12 | Boch Honda |
| 13 | Boch Toyota Norwood |
| 14 | Parkway Honda |
| 15 | Lexus of Watertown |
| 16 | Imperial Ford |
| 17 | Champion City Motors |
| 18 | Commonwealth Volkswagen |
| 19 | Audi Westwood |
| 20 | Herb Connolly Acura of Framingham |
| 21 | Acton Toyota of Littleton |
| 22 | Kelly Honda |
| 23 | McGovern Ford of Lowell |
| 24 | Westboro Toyota |
| 25 | Woburn Toyota |
Most Active Independent Dealers
Based on number of vehicles sold by independent auto dealers
| 1 | 24 Auto Group |
| 2 | AutoMax Preowned |
| 3 | Imperial Cars |
| 4 | Bourne's Auto Center |
| 5 | Champion City Motors |
| 6 | Autobahn USA Westborough |
| 7 | Midway Automotive Corp |
| 8 | Lyon-Waugh Auto Group |
| 9 | Wagner Motors |
| 10 | Richards Motorcars |
| 11 | John's Auto Sales |
| 12 | Avon Auto Brokers |
| 13 | Mirak Automotive Group |
| 14 | BidCars Boston |
| 15 | Central Auto Team |
| 16 | Autobahn USA Dedham |
| 17 | Inman Motors Sales |
| 18 | DirectAutomecca.com |
| 19 | AGM AUTO SALES |
| 20 | Mass Auto Exchange |
Retail Used Inventory Levels
Highest Demand Vehicles in Boston for December
Based on number of vehicles sold and average days on lot
| 1 | HONDA CR-V | Score: 96 |
| 2 | TOYOTA RAV4 | Score: 92 |
| 3 | HONDA ACCORD | Score: 89 |
| 4 | HONDA CIVIC | Score: 88 |
| 5 | AUDI Q5 | Score: 85 |
| 6 | JEEP GRAND CHEROKEE | Score: 85 |
| 7 | TOYOTA CAMRY | Score: 83 |
| 8 | HONDA HR-V | Score: 83 |
| 9 | MAZDA CX-5 | Score: 82 |
| 10 | TOYOTA COROLLA | Score: 81 |
| 11 | FORD F-150 | Score: 81 |
| 12 | HYUNDAI ELANTRA | Score: 81 |
| 13 | SUBARU IMPREZA | Score: 78 |
| 14 | SUBARU OUTBACK | Score: 78 |
| 15 | NISSAN ROGUE | Score: 78 |
| 16 | CHEVROLET SILVERADO | Score: 78 |
| 17 | SUBARU FORESTER | Score: 77 |
| 18 | VOLKSWAGEN JETTA | Score: 77 |
| 19 | JEEP COMPASS | Score: 77 |
| 20 | GMC SIERRA | Score: 76 |
| 21 | HYUNDAI TUCSON | Score: 76 |
| 22 | TOYOTA HIGHLANDER | Score: 76 |
| 23 | FORD EXPLORER | Score: 75 |
| 24 | FORD FUSION | Score: 74 |
| 25 | RAM 1500 | Score: 73 |
Lowest Days on Lot Vehicles
Based on average days on lot for December
| 1 | MAZDA CX-5 | 30.6 days |
| 2 | HYUNDAI ELANTRA | 30.6 days |
| 3 | HONDA HR-V | 30.9 days |
| 4 | AUDI Q5 | 31.0 days |
| 5 | SUBARU OUTBACK | 32.3 days |
| 6 | SUBARU IMPREZA | 32.5 days |
| 7 | VOLKSWAGEN JETTA | 34.4 days |
| 8 | HYUNDAI TUCSON | 34.6 days |
| 9 | SUBARU FORESTER | 34.9 days |
| 10 | TOYOTA CAMRY | 35.3 days |
| 11 | HONDA ACCORD | 35.4 days |
| 12 | TOYOTA COROLLA | 37.1 days |
| 13 | TOYOTA RAV4 | 37.3 days |
| 14 | FORD FUSION | 37.4 days |
| 15 | JEEP COMPASS | 38.5 days |
| 16 | HONDA CIVIC | 38.6 days |
| 17 | GMC SIERRA | 39.3 days |
| 18 | CHEVROLET EQUINOX | 39.6 days |
| 19 | NISSAN ROGUE | 40.1 days |
| 20 | NISSAN ALTIMA | 40.3 days |
| 21 | HONDA CR-V | 40.4 days |
| 22 | NISSAN SENTRA | 40.8 days |
| 23 | RAM 1500 | 41.0 days |
| 24 | BMW X3 | 42.0 days |
| 25 | TOYOTA HIGHLANDER | 42.7 days |
Days on Lot Trend in the Boston Region
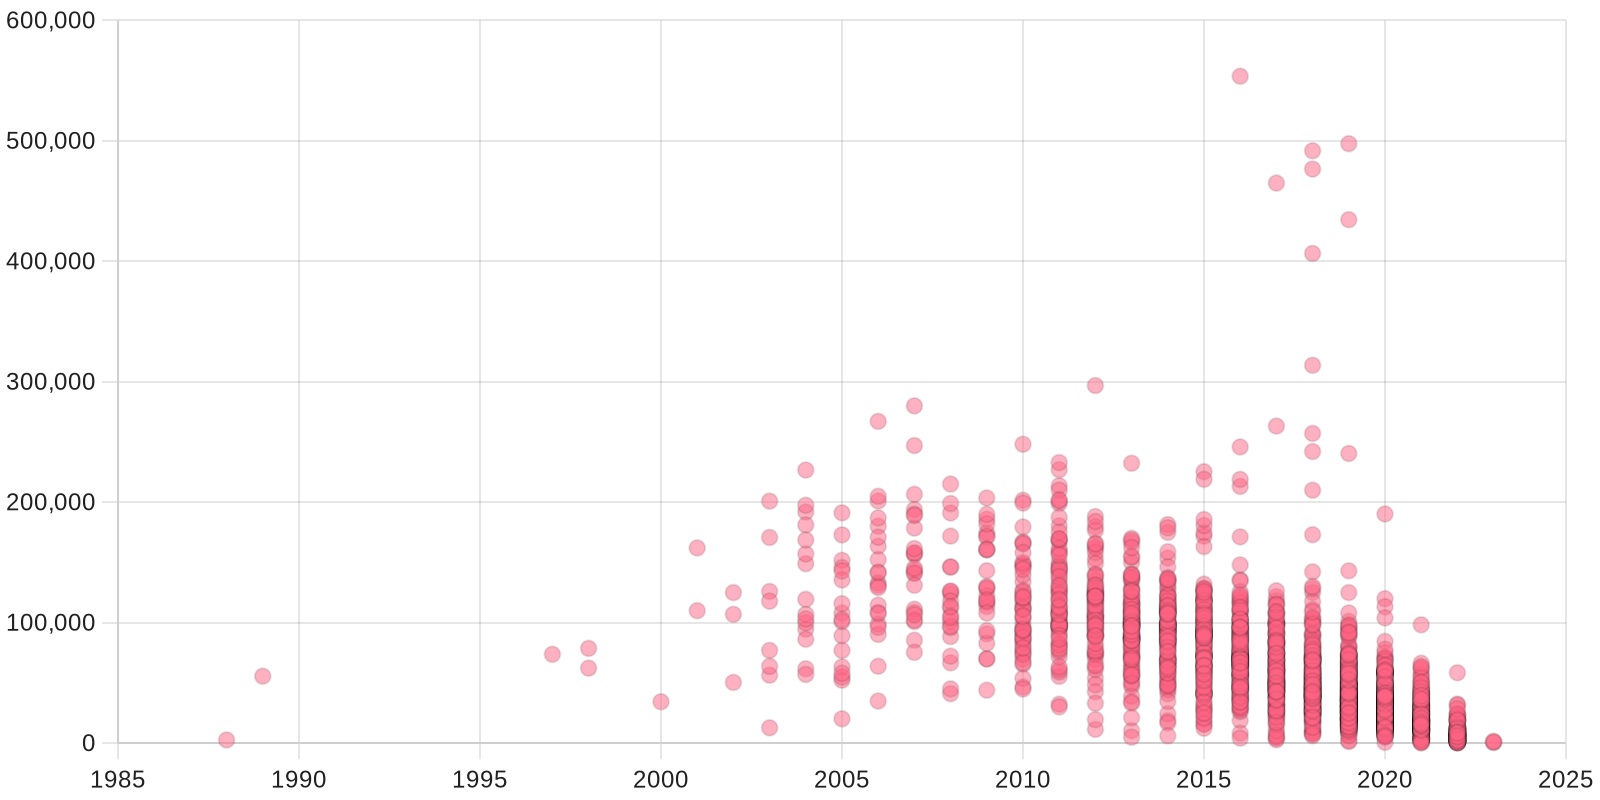
December Used Inventory by Year and Mileage
All vehicles for sale in Boston