Boston Region Used Car Market Report
January 2023

Most Active Dealers
| 1 | The Herb Chambers Companies |
| 2 | CarMax - Westborough |
| 3 | CarMax - Norwood |
| 4 | Jaguar Norwood |
| 5 | McGovern Automotive Group |
| 6 | CarMax - Danvers |
| 7 | Bourne's Auto Center |
| 8 | AutoMax Preowned |
| 9 | 24 Auto Group |
| 10 | Imperial Cars |
| 11 | Albrecht Auto Group |
| 12 | Midway Automotive Corp |
| 13 | Lexus of Watertown |
| 14 | Boch Toyota Norwood |
| 15 | Boch Honda |
| 16 | Autobahn USA Westborough |
| 17 | Herb Connolly Acura of Framingham |
| 18 | Commonwealth Volkswagen |
| 19 | Woburn Toyota |
| 20 | Imperial Toyota |
| 21 | Allegiance Trucks |
| 22 | McGovern Honda |
| 23 | Imperial Ford |
| 24 | Audi Westwood |
| 25 | Kelly Honda |
Most Active Independent Dealers
| 1 | Bourne's Auto Center |
| 2 | AutoMax Preowned |
| 3 | 24 Auto Group |
| 4 | Imperial Cars |
| 5 | Midway Automotive Corp |
| 6 | Autobahn USA Westborough |
| 7 | Avon Auto Brokers |
| 8 | Inman Motors Sales |
| 9 | BidCars Boston |
| 10 | Autobahn USA Dedham |
| 11 | Central Auto Team |
| 12 | Mirak Automotive Group |
| 13 | Wagner Motors |
| 14 | John's Auto Sales |
| 15 | Richards Motorcars |
| 16 | Champion City Motors |
| 17 | Mass Auto Exchange |
| 18 | Boston Foreign Motor |
| 19 | Colonial Ford of Marlboro |
| 20 | Foley Motorsports |
Retail Used Inventory Levels

Highest Demand Vehicles in Boston for January
| 1 | HONDA CR-V | Score: 99 |
| 2 | TOYOTA RAV4 | Score: 93 |
| 3 | LAND ROVER RANGE ROVER SPORT | Score: 92 |
| 4 | HONDA ACCORD | Score: 84 |
| 5 | HONDA CIVIC | Score: 83 |
| 6 | TOYOTA CAMRY | Score: 82 |
| 7 | AUDI Q5 | Score: 81 |
| 8 | TOYOTA COROLLA | Score: 81 |
| 9 | BMW X3 | Score: 81 |
| 10 | VOLKSWAGEN TIGUAN | Score: 80 |
| 11 | FORD F-150 | Score: 79 |
| 12 | HONDA HR-V | Score: 79 |
| 13 | MAZDA CX-5 | Score: 77 |
| 14 | CHEVROLET SILVERADO | Score: 77 |
| 15 | JEEP GRAND CHEROKEE | Score: 77 |
| 16 | SUBARU FORESTER | Score: 76 |
| 17 | JEEP COMPASS | Score: 76 |
| 18 | NISSAN ROGUE | Score: 75 |
| 19 | ACURA MDX | Score: 75 |
| 20 | VOLKSWAGEN JETTA | Score: 75 |
| 21 | HONDA ODYSSEY | Score: 74 |
| 22 | HYUNDAI TUCSON | Score: 74 |
| 23 | JEEP CHEROKEE | Score: 73 |
| 24 | SUBARU OUTBACK | Score: 72 |
| 25 | RAM 1500 | Score: 71 |
Lowest Days on Lot Vehicles
| 1 | LAND ROVER RANGE ROVER SPORT | 22.3 days |
| 2 | BMW X3 | 29.7 days |
| 3 | VOLKSWAGEN TIGUAN | 30.9 days |
| 4 | AUDI Q5 | 33.1 days |
| 5 | HONDA HR-V | 34.1 days |
| 6 | MAZDA CX-5 | 34.5 days |
| 7 | ACURA MDX | 35.2 days |
| 8 | HONDA CR-V | 35.8 days |
| 9 | VOLKSWAGEN JETTA | 35.9 days |
| 10 | HONDA ODYSSEY | 36.3 days |
| 11 | HYUNDAI TUCSON | 36.4 days |
| 12 | JEEP COMPASS | 37.2 days |
| 13 | SUBARU FORESTER | 37.4 days |
| 14 | TOYOTA RAV4 | 37.9 days |
| 15 | SUBARU OUTBACK | 38.8 days |
| 16 | TOYOTA CAMRY | 39.3 days |
| 17 | TOYOTA COROLLA | 40.2 days |
| 18 | JEEP CHEROKEE | 40.5 days |
| 19 | HONDA ACCORD | 42.4 days |
| 20 | NISSAN ROGUE | 43.2 days |
| 21 | HONDA CIVIC | 43.3 days |
| 22 | RAM 1500 | 43.4 days |
| 23 | HYUNDAI ELANTRA | 43.6 days |
| 24 | FORD F-150 | 44.0 days |
| 25 | CHEVROLET SILVERADO | 44.2 days |
Days on Lot Trend in the Boston Region

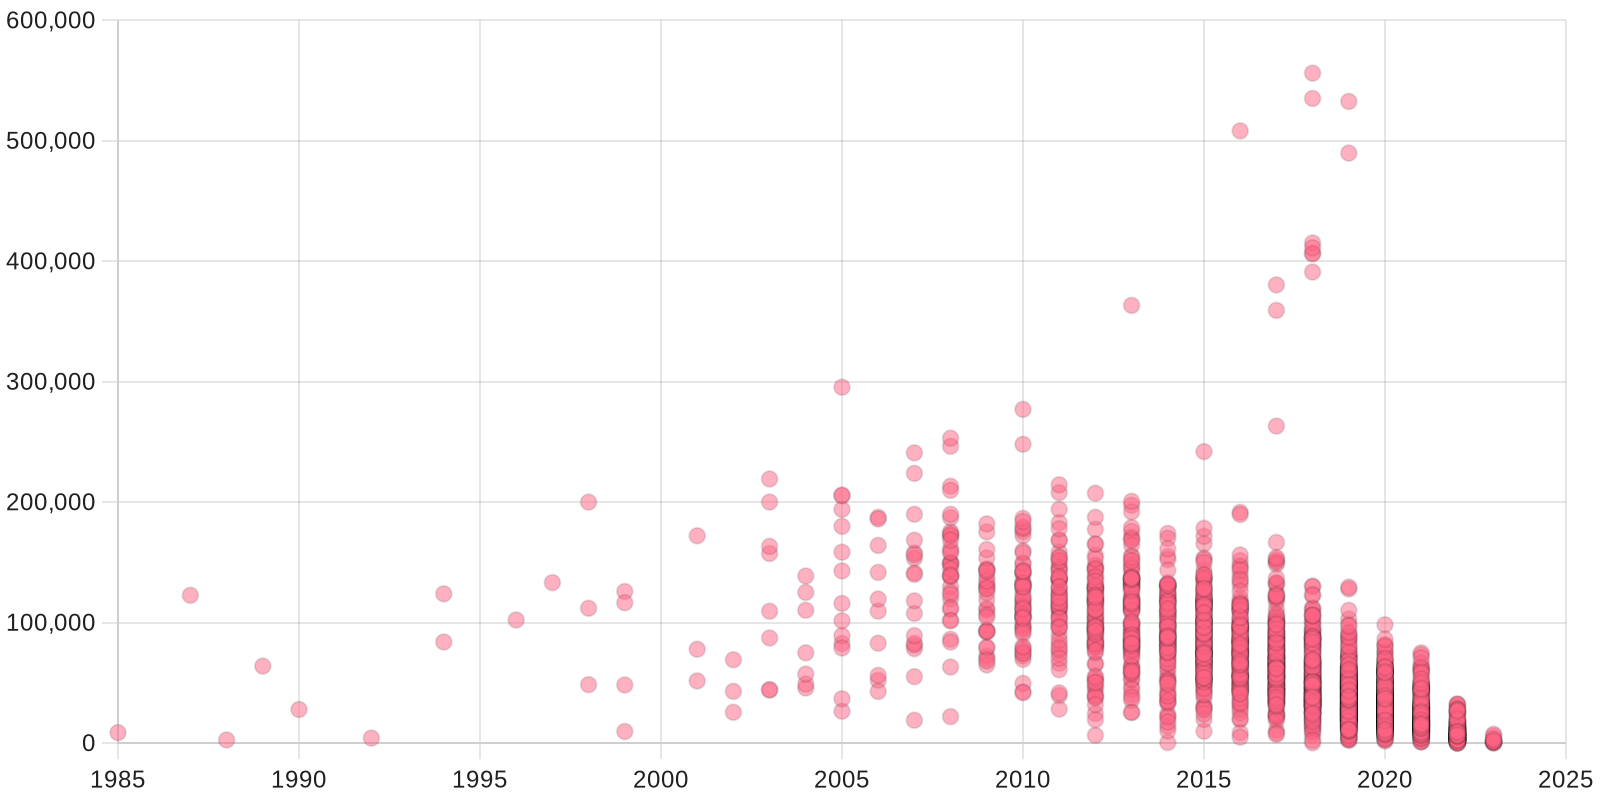
January Used Inventory by Year and Mileage
