Kansas City Region Used Car Market Report
January 2023
Used car sales trends for Kansas City and surrounding communities
January market trends based on used inventory from 322 dealers in the Kansas City region.
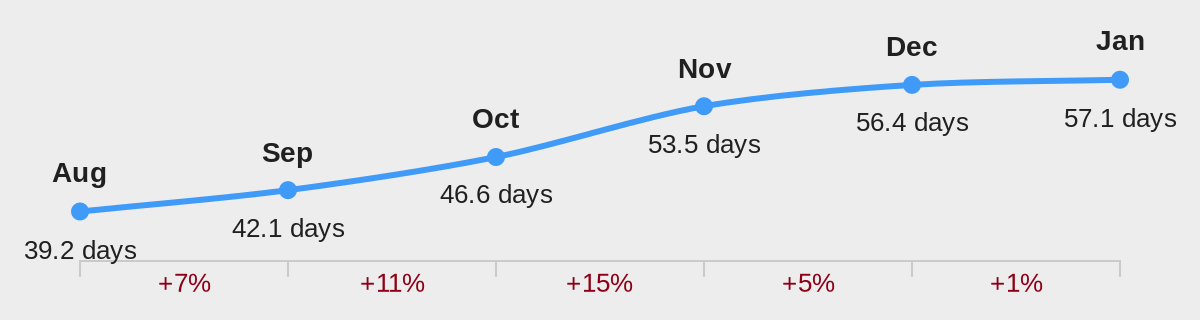
57.1 days
Average turn
Up 1.2%
35.4 days
Average vehicles sold per dealer
Up 2.8%

Average national wholesale values by month
Wholesale values declined slightly in January, but the decrease slowed from previous months.
Most Active Dealers
Based on number of vehicles sold
| 1 | CarMax - Kansas City |
| 2 | CarMax - Independence |
| 3 | Cable Dahmer Independence Chevrolet |
| 4 | Jay Wolfe Toyota Kansas City |
| 5 | Zeck Ford Kansas |
| 6 | Show Me Auto Mall |
| 7 | Universal Auto Plaza KC |
| 8 | Wood Nissan of Lee's Summit |
| 9 | Luxury and Imports - Leavenworth |
| 10 | Northtowne Volkswagen |
| 11 | Volkswagen Lee's Summit |
| 12 | Olathe Ford Lincoln |
| 13 | Cable Dahmer Kansas City Chevrolet |
| 14 | Victory Chrysler Dodge Jeep Ram |
| 15 | Blue Springs Ford |
| 16 | Victory Chevrolet of Smithville |
| 17 | Lee's Summit |
| 18 | Cable Dahmer Kia |
| 19 | Victory Chevrolet Buick GMC Paola |
| 20 | Heartland Chevrolet |
| 21 | Honda of Olathe |
| 22 | Jack Miller Auto Plaza |
| 23 | Legends Toyota |
| 24 | Bob Sight Independence Kia |
| 25 | Landmark Dodge Chrysler Jeep |
Most Active Independent Dealers
Based on number of vehicles sold by independent auto dealers
| 1 | Show Me Auto Mall |
| 2 | Universal Auto Plaza KC |
| 3 | Luxury and Imports - Leavenworth |
| 4 | Lee's Summit |
| 5 | Jack Miller Auto Plaza |
| 6 | Silver Eagle Auto Mall Inc |
| 7 | KC Used Car Emporium |
| 8 | Premier Auto Outlet KC |
| 9 | Auto Bank of Kansas City |
| 10 | Auto Now |
| 11 | KWIK AUTO FINANCE |
| 12 | Munsterman Automotive Group |
| 13 | The Big Lot Car Credit |
| 14 | Carport Enterprise "US Motors" - Missouri |
| 15 | Cars Plus Credit |
| 16 | Nationwide Auto |
| 17 | Premier Pre-Owned KC |
| 18 | Street Side Auto Sales |
| 19 | Leen Motors |
| 20 | Midwest Auto Financial LLC |
Retail Used Inventory Levels

Highest Demand Vehicles in Kansas City for January
Based on number of vehicles sold and average days on lot
| 1 | CHEVROLET SILVERADO | Score: 93 |
| 2 | FORD F-150 | Score: 92 |
| 3 | CHEVROLET EQUINOX | Score: 90 |
| 4 | FORD FOCUS | Score: 88 |
| 5 | FORD FUSION | Score: 87 |
| 6 | CHEVROLET MALIBU | Score: 86 |
| 7 | HONDA CIVIC | Score: 84 |
| 8 | FORD EXPLORER | Score: 83 |
| 9 | FORD ESCAPE | Score: 82 |
| 10 | NISSAN ALTIMA | Score: 82 |
| 11 | RAM 1500 | Score: 82 |
| 12 | JEEP WRANGLER UNLIMITED | Score: 81 |
| 13 | TOYOTA CAMRY | Score: 81 |
| 14 | JEEP GRAND CHEROKEE | Score: 80 |
| 15 | FORD EDGE | Score: 79 |
| 16 | NISSAN ROGUE | Score: 77 |
| 17 | HONDA ACCORD | Score: 76 |
| 18 | HONDA CR-V | Score: 73 |
| 19 | GMC SIERRA | Score: 73 |
Lowest Days on Lot Vehicles
Based on average days on lot for January
| 1 | FORD FOCUS | 27.4 days |
| 2 | HONDA CIVIC | 31.8 days |
| 3 | TOYOTA CAMRY | 34.6 days |
| 4 | FORD FUSION | 34.9 days |
| 5 | CHEVROLET MALIBU | 35.4 days |
| 6 | JEEP WRANGLER UNLIMITED | 35.5 days |
| 7 | NISSAN ALTIMA | 35.6 days |
| 8 | CHEVROLET EQUINOX | 37.2 days |
| 9 | NISSAN ROGUE | 38.7 days |
| 10 | FORD EDGE | 39.3 days |
| 11 | JEEP GRAND CHEROKEE | 39.7 days |
| 12 | FORD EXPLORER | 40.1 days |
| 13 | RAM 1500 | 41.2 days |
| 14 | CHEVROLET SILVERADO | 42.1 days |
| 15 | HONDA ACCORD | 42.1 days |
| 16 | HONDA CR-V | 42.8 days |
| 17 | FORD ESCAPE | 42.9 days |
| 18 | GMC SIERRA | 45.7 days |
| 19 | FORD F-150 | 46.3 days |
Days on Lot Trend in the Kansas City Region
January Used Inventory by Year and Mileage
All vehicles for sale in Kansas City