Minneapolis Region Used Car Market Report
January 2023
Used car sales trends for Minneapolis and surrounding communities
January market trends based on used inventory from 358 dealers in the Minneapolis region.
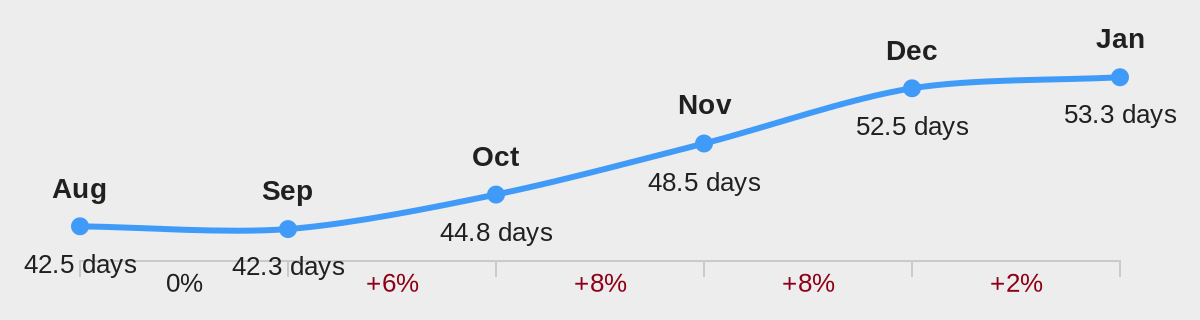
53.3 days
Average turn
Up 1.5%
35.4 days
Average vehicles sold per dealer
Down 8.6%

Average national wholesale values by month
Wholesale values declined slightly in January, but the decrease slowed from previous months.
Most Active Dealers
Based on number of vehicles sold
| 1 | Apple Chrysler Dodge Jeep Ram |
| 2 | Walser Toyota |
| 3 | Morrie's Forest Lake Chrysler Dodge Jeep RAM |
| 4 | Jeff Belzer's |
| 5 | CarMax - Brooklyn Park |
| 6 | Apple Ford Apple Valley |
| 7 | White Bear Mitsubishi |
| 8 | Maplewood Toyota |
| 9 | Rudy Luther Toyota |
| 10 | Luther Kia in Inver Grove |
| 11 | Buerkle Automotive Group |
| 12 | Walser Chrysler Jeep Dodge RAM |
| 13 | Walser Honda |
| 14 | Mauer Chevrolet |
| 15 | Walser Hyundai |
| 16 | Richfield Bloomington Honda |
| 17 | Motorwerks BMW |
| 18 | Luther Westside Volkswagen |
| 19 | Bloomington Subaru |
| 20 | Walser Burnsville Mazda |
| 21 | Walser Nissan Burnsville |
| 22 | Luther Brookdale Toyota |
| 23 | Lincoln of Bloomington |
| 24 | White Bear Acura |
| 25 | Luther Brookdale Honda |
Most Active Independent Dealers
Based on number of vehicles sold by independent auto dealers
| 1 | Marty's Auto Sales |
| 2 | Bedrock Motors |
| 3 | Bobs Auto Ranch |
| 4 | Drive Appeal |
| 5 | RAVMOTORS |
| 6 | Luther Used Car Company |
| 7 | Walser Experienced Autos |
| 8 | Dakota Motor Company |
| 9 | Chinos Auto Sales |
| 10 | Feldmann Imports |
| 11 | East Side Auto |
| 12 | Burnsville Motors |
| 13 | Ace Auto |
| 14 | SS Motors |
| 15 | Auto Center Bargain Lot |
| 16 | Wholesale Enterprises |
| 17 | Lexdan Automotive of Maplewood |
| 18 | Cornerstone Plymouth |
| 19 | University Auto Sales Maplewood |
| 20 | Jackson Auto East |
Retail Used Inventory Levels

Highest Demand Vehicles in Minneapolis for January
Based on number of vehicles sold and average days on lot
| 1 | FORD F-150 | Score: 113 |
| 2 | CHEVROLET SILVERADO | Score: 97 |
| 3 | TOYOTA RAV4 | Score: 92 |
| 4 | TOYOTA HIGHLANDER | Score: 89 |
| 5 | NISSAN ROGUE | Score: 87 |
| 6 | HONDA CR-V | Score: 85 |
| 7 | SUBARU OUTBACK | Score: 84 |
| 8 | GMC SIERRA | Score: 83 |
| 9 | SUBARU FORESTER | Score: 82 |
| 10 | CHEVROLET EQUINOX | Score: 82 |
| 11 | RAM 1500 | Score: 82 |
| 12 | FORD EXPLORER | Score: 81 |
| 13 | FORD FUSION | Score: 80 |
| 14 | FORD EDGE | Score: 80 |
| 15 | JEEP GRAND CHEROKEE | Score: 80 |
| 16 | TOYOTA CAMRY | Score: 80 |
| 17 | FORD ESCAPE | Score: 79 |
| 18 | TOYOTA SIENNA | Score: 77 |
| 19 | HYUNDAI TUCSON | Score: 77 |
| 20 | MAZDA CX-5 | Score: 77 |
| 21 | CHEVROLET MALIBU | Score: 75 |
| 22 | JEEP COMPASS | Score: 74 |
| 23 | HONDA CIVIC | Score: 70 |
| 24 | TOYOTA COROLLA | Score: 69 |
| 25 | HONDA PILOT | Score: 69 |
Lowest Days on Lot Vehicles
Based on average days on lot for January
| 1 | TOYOTA HIGHLANDER | 28.1 days |
| 2 | NISSAN ROGUE | 31.5 days |
| 3 | SUBARU OUTBACK | 32.2 days |
| 4 | SUBARU FORESTER | 32.5 days |
| 5 | FORD FUSION | 33.3 days |
| 6 | TOYOTA RAV4 | 33.5 days |
| 7 | FORD F-150 | 34.0 days |
| 8 | GMC SIERRA | 34.1 days |
| 9 | FORD EDGE | 34.5 days |
| 10 | HYUNDAI TUCSON | 34.6 days |
| 11 | TOYOTA SIENNA | 35.2 days |
| 12 | CHEVROLET MALIBU | 36.5 days |
| 13 | JEEP COMPASS | 37.0 days |
| 14 | TOYOTA CAMRY | 38.5 days |
| 15 | MAZDA CX-5 | 39.7 days |
| 16 | HONDA CR-V | 40.1 days |
| 17 | CHEVROLET SILVERADO | 41.2 days |
| 18 | FORD EXPLORER | 41.2 days |
| 19 | FORD ESCAPE | 41.6 days |
| 20 | RAM 1500 | 41.8 days |
| 21 | CHEVROLET EQUINOX | 42.5 days |
| 22 | TOYOTA COROLLA | 42.8 days |
| 23 | GMC ACADIA | 43.4 days |
| 24 | CHRYSLER PACIFICA | 43.7 days |
| 25 | JEEP GRAND CHEROKEE | 43.8 days |
Days on Lot Trend in the Minneapolis Region
January Used Inventory by Year and Mileage
All vehicles for sale in Minneapolis