Philadelphia Region Used Car Market Report
November 2022
Used car sales trends for Philadelphia and surrounding communities
November market trends based on used inventory from 551 dealers in the Philadelphia region.
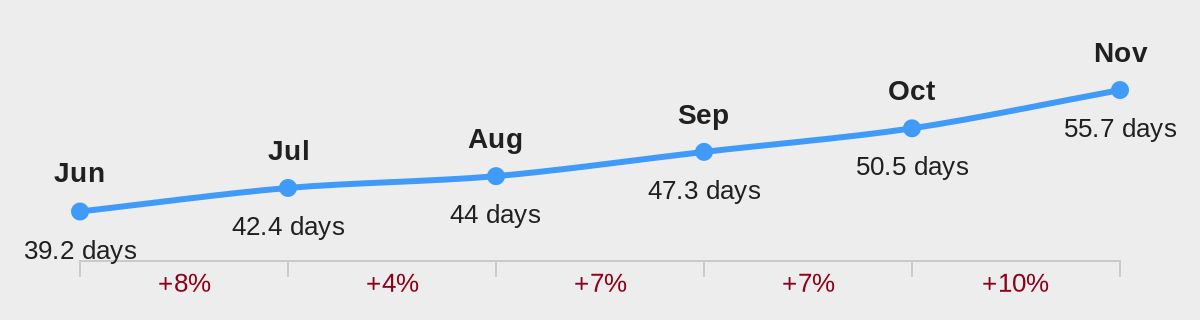
55.7 days
Average turn
Up 10.3%
35.4 days
Average vehicles sold per dealer
Down 3.1%
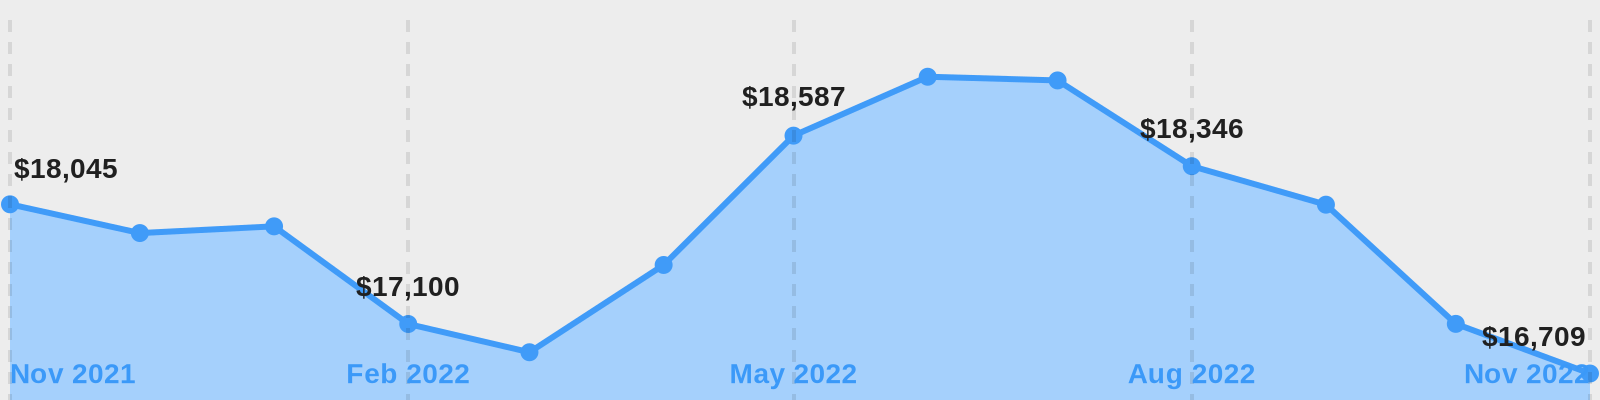
Average national wholesale values by month
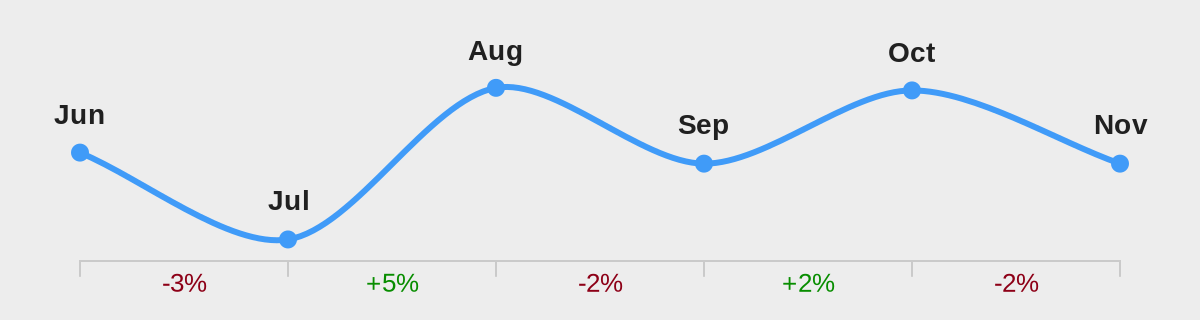
Wholesale values continued their decline in November. Average wholesale values are down 2% nationally from October.
Most Active Dealers
Based on number of vehicles sold
| 1 | CarMax - Turnersville |
| 2 | CarMax - Maple Shade |
| 3 | Car Vision Mitsubishi Norristown |
| 4 | CarMax - King of Prussia |
| 5 | CarMax - Langhorne |
| 6 | Holman Toyota |
| 7 | Apollo Auto Sales |
| 8 | Peruzzi Mazda |
| 9 | Burns Hyundai |
| 10 | Toyota of Runnemede |
| 11 | Bergey's Buick GMC |
| 12 | Pacifico Auto Group |
| 13 | Mayfair Imports Auto Sales |
| 14 | Team Toyota of Langhorne |
| 15 | BMW of Mount Laurel |
| 16 | Davis Honda |
| 17 | Conicelli Toyota of Conshohocken |
| 18 | Burns Honda |
| 19 | Holman Ford Maple Shade |
| 20 | Infiniti of Ardmore |
| 21 | Samson Motors |
| 22 | Sloane Toyota of Philadelphia |
| 23 | Conicelli Honda |
| 24 | Holman Ford Turnersville |
| 25 | F.C. Kerbeck Buick GMC |
Most Active Independent Dealers
Based on number of vehicles sold by independent auto dealers
| 1 | Apollo Auto Sales |
| 2 | Mayfair Imports Auto Sales |
| 3 | Samson Motors |
| 4 | Premier Auto Group |
| 5 | A & R Used Cars |
| 6 | CarsIndex County Line Rd |
| 7 | J&S 6 Mt. Holly |
| 8 | Car N Drive |
| 9 | Highline Motor Cars |
| 10 | Sloane Automotive Group |
| 11 | Car Revolution |
| 12 | Royal Auto Group of Burlington |
| 13 | Pro Sport Motors |
| 14 | Mainline Auto LLC |
| 15 | Grace Auto Group |
| 16 | Scott Select |
| 17 | Bristol Auto Mall |
| 18 | PA AUTO WORLD INC |
| 19 | G MOTORS |
| 20 | King of Cars and Trucks |
Retail Used Inventory Levels
Highest Demand Vehicles in Philadelphia for November
Based on number of vehicles sold and average days on lot
| 1 | HONDA CIVIC | Score: 98 |
| 2 | HONDA ACCORD | Score: 93 |
| 3 | TOYOTA COROLLA | Score: 93 |
| 4 | TOYOTA CAMRY | Score: 92 |
| 5 | TOYOTA RAV4 | Score: 91 |
| 6 | HONDA CR-V | Score: 87 |
| 7 | NISSAN SENTRA | Score: 85 |
| 8 | NISSAN ALTIMA | Score: 85 |
| 9 | FORD FOCUS | Score: 84 |
| 10 | FORD F-150 | Score: 84 |
| 11 | NISSAN ROGUE | Score: 84 |
| 12 | VOLKSWAGEN JETTA | Score: 83 |
| 13 | TOYOTA HIGHLANDER | Score: 83 |
| 14 | FORD ESCAPE | Score: 83 |
| 15 | FORD EXPLORER | Score: 82 |
| 16 | HYUNDAI TUCSON | Score: 82 |
| 17 | MAZDA CX-5 | Score: 81 |
| 18 | JEEP GRAND CHEROKEE | Score: 80 |
| 19 | HYUNDAI SONATA | Score: 79 |
| 20 | SUBARU FORESTER | Score: 79 |
| 21 | JEEP CHEROKEE | Score: 78 |
| 22 | AUDI Q5 | Score: 78 |
| 23 | VOLKSWAGEN TIGUAN | Score: 78 |
| 24 | CHEVROLET MALIBU | Score: 77 |
| 25 | JEEP COMPASS | Score: 75 |
Lowest Days on Lot Vehicles
Based on average days on lot for November
| 1 | HONDA CIVIC | 25.9 days |
| 2 | FORD FOCUS | 26.9 days |
| 3 | TOYOTA COROLLA | 28.1 days |
| 4 | HONDA ACCORD | 28.5 days |
| 5 | VOLKSWAGEN JETTA | 28.8 days |
| 6 | HYUNDAI TUCSON | 28.9 days |
| 7 | NISSAN SENTRA | 29.1 days |
| 8 | MAZDA CX-5 | 30.6 days |
| 9 | TOYOTA CAMRY | 31.5 days |
| 10 | TOYOTA HIGHLANDER | 32.0 days |
| 11 | VOLKSWAGEN TIGUAN | 32.2 days |
| 12 | AUDI Q5 | 32.2 days |
| 13 | SUBARU FORESTER | 32.8 days |
| 14 | TOYOTA RAV4 | 33.5 days |
| 15 | HYUNDAI SONATA | 34.0 days |
| 16 | CHEVROLET MALIBU | 35.7 days |
| 17 | NISSAN ALTIMA | 36.0 days |
| 18 | HONDA CR-V | 36.5 days |
| 19 | JEEP CHEROKEE | 36.9 days |
| 20 | SUBARU OUTBACK | 37.6 days |
| 21 | GMC SIERRA | 38.2 days |
| 22 | JEEP COMPASS | 38.4 days |
| 23 | FORD EXPLORER | 38.5 days |
| 24 | GMC TERRAIN | 38.6 days |
| 25 | FORD F-150 | 39.1 days |
Days on Lot Trend in the Philadelphia Region
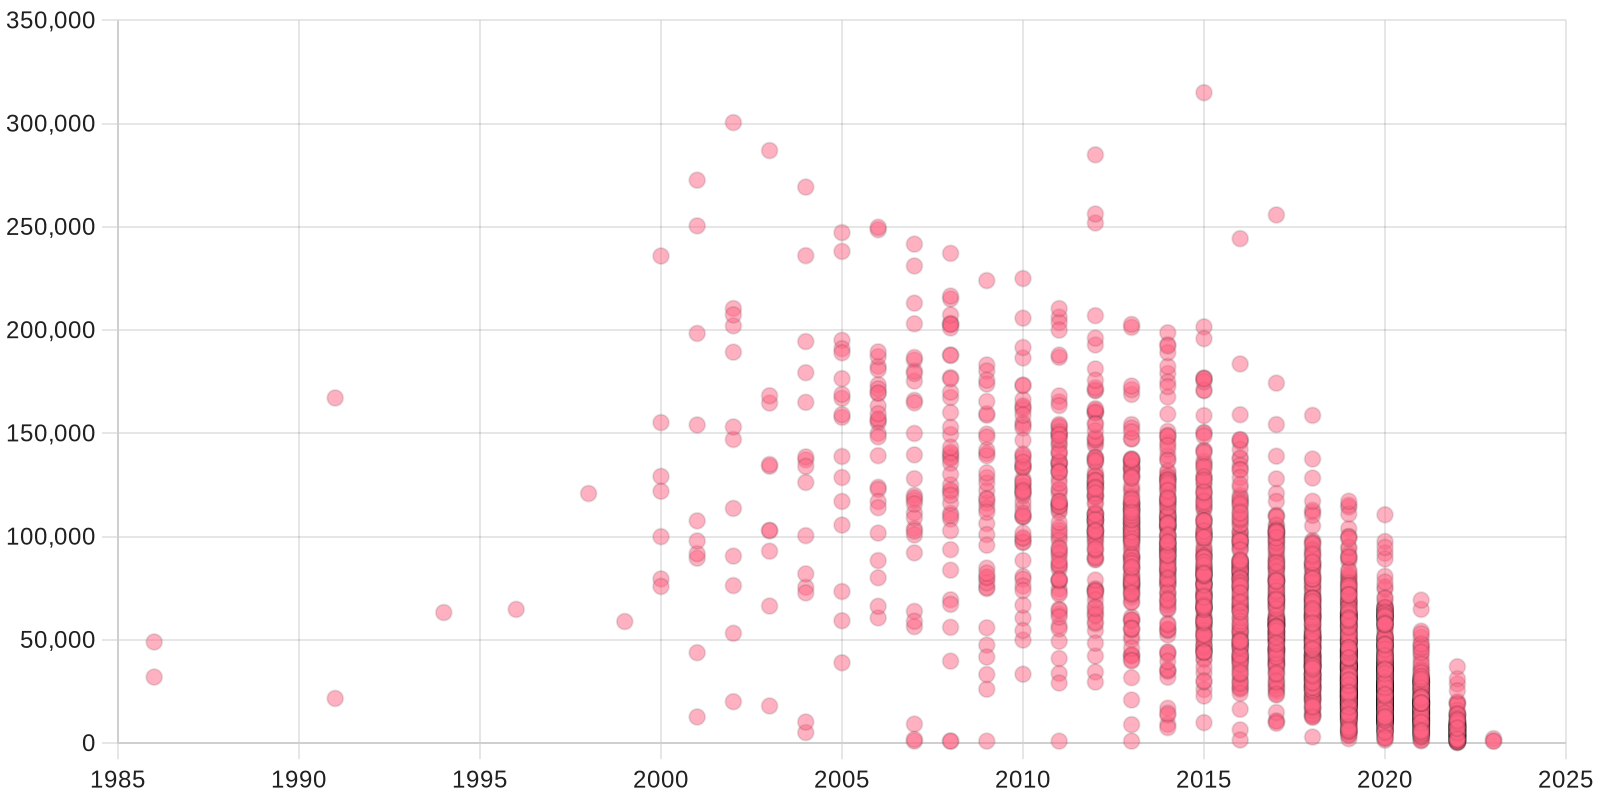
November Used Inventory by Year and Mileage
All vehicles for sale in Philadelphia